Bitcoin Weekly Forecast: BTC to hit point of max pain before breaking out to $100,000
- Bitcoin price is looking top-heavy from a short-term time frame perspective indicating a retracement is likely.
- BTC needs to produce a daily close above $62,000 to circumvent this correction.
- On-chain metrics and high funding rates suggest that the big crypto needs a reset.

Bitcoin price is hovering just above $60,000 after a brief dip below it on October 27. Despite the recent respite, things look grim for BTC if it cannot stay above the psychological barrier.
ETF hype dies down
Bitcoin price saw a massive boost as the SEC began approving Bitcoin ETFs. However, the hype seems to have vanished, leaving BTC high and dry. MicroStrategy CEO, Michael Saylor took advantage of the recent dips in Q3 as the company accumulated nearly 9,000 BTC in this period. The same trend was seen with El Salvador, the country that made BTC a legal tender. President Nayib Bukele mentioned in a series of tweets that the country bought the "dip."
Bukele further tweeted,
We have a trust fund accounted in USD, but the trust is funded by both USD and BTC. When the BTC part revalues in comparison to the accounting currency (USD), we are able to withdraw some USD and leave the trust with the same total.
On the note of Bitcoin adoption, the US regulators are reportedly exploring how the US banks could hold Bitcoin. Federal Deposit Insurance Corporation chair Jelena McWilliams stated that US bank regulators are working on providing a roadmap for banks to hold crypto assets.
McWilliams stated during a fintech conference,
I think that we need to allow banks in this space, while appropriately managing and mitigating risk... If we don't bring this activity inside the banks, it is going to develop outside of the banks. ... The federal regulators won't be able to regulate it.
Bitcoin price needs to drop before it can fly
Bitcoin price dropped roughly 14% since its all-time high on October 20. However, after briefly dipping below the $60,000 level, BTC recovered on October 28. Currently, Bitcoin price is above the psychological barrier mentioned above, but it needs to produce a decisive daily candlestick close above $62,000 to have any chance of going higher.
Failing to do so will likely result in a retracement to the demand zone ranging from $56,629 to $58,587. A potential spike in selling pressure that knocks Bitcoin price back down, with a daily candlestick close below $56,006, will trigger a downswing to the $55,347 support level. If bitcoin reaches this point, market makers will likely push the big crypto to the $53,000 demand level to collect liquidity. Doing so will alleviate the selling pressure for Bitcoin price, allowing it to reverse its downtrend and kickstart a new rally.
While this short-term correction might be bearish, it will help Bitcoin embark on a journey that will propel it past its current all-time high. In such a situation, the bulls will set their eyes on the 161.8% trend-based Fibonacci extension at $77,908. This ascent would be a 47% gain from $53,000.
Clearing the $77,000 level would open the path for BTC to go to six-digits at $100,000, coinciding with to 61.8% trend-based Fibonacci extension level. This move would set a new all-time high.
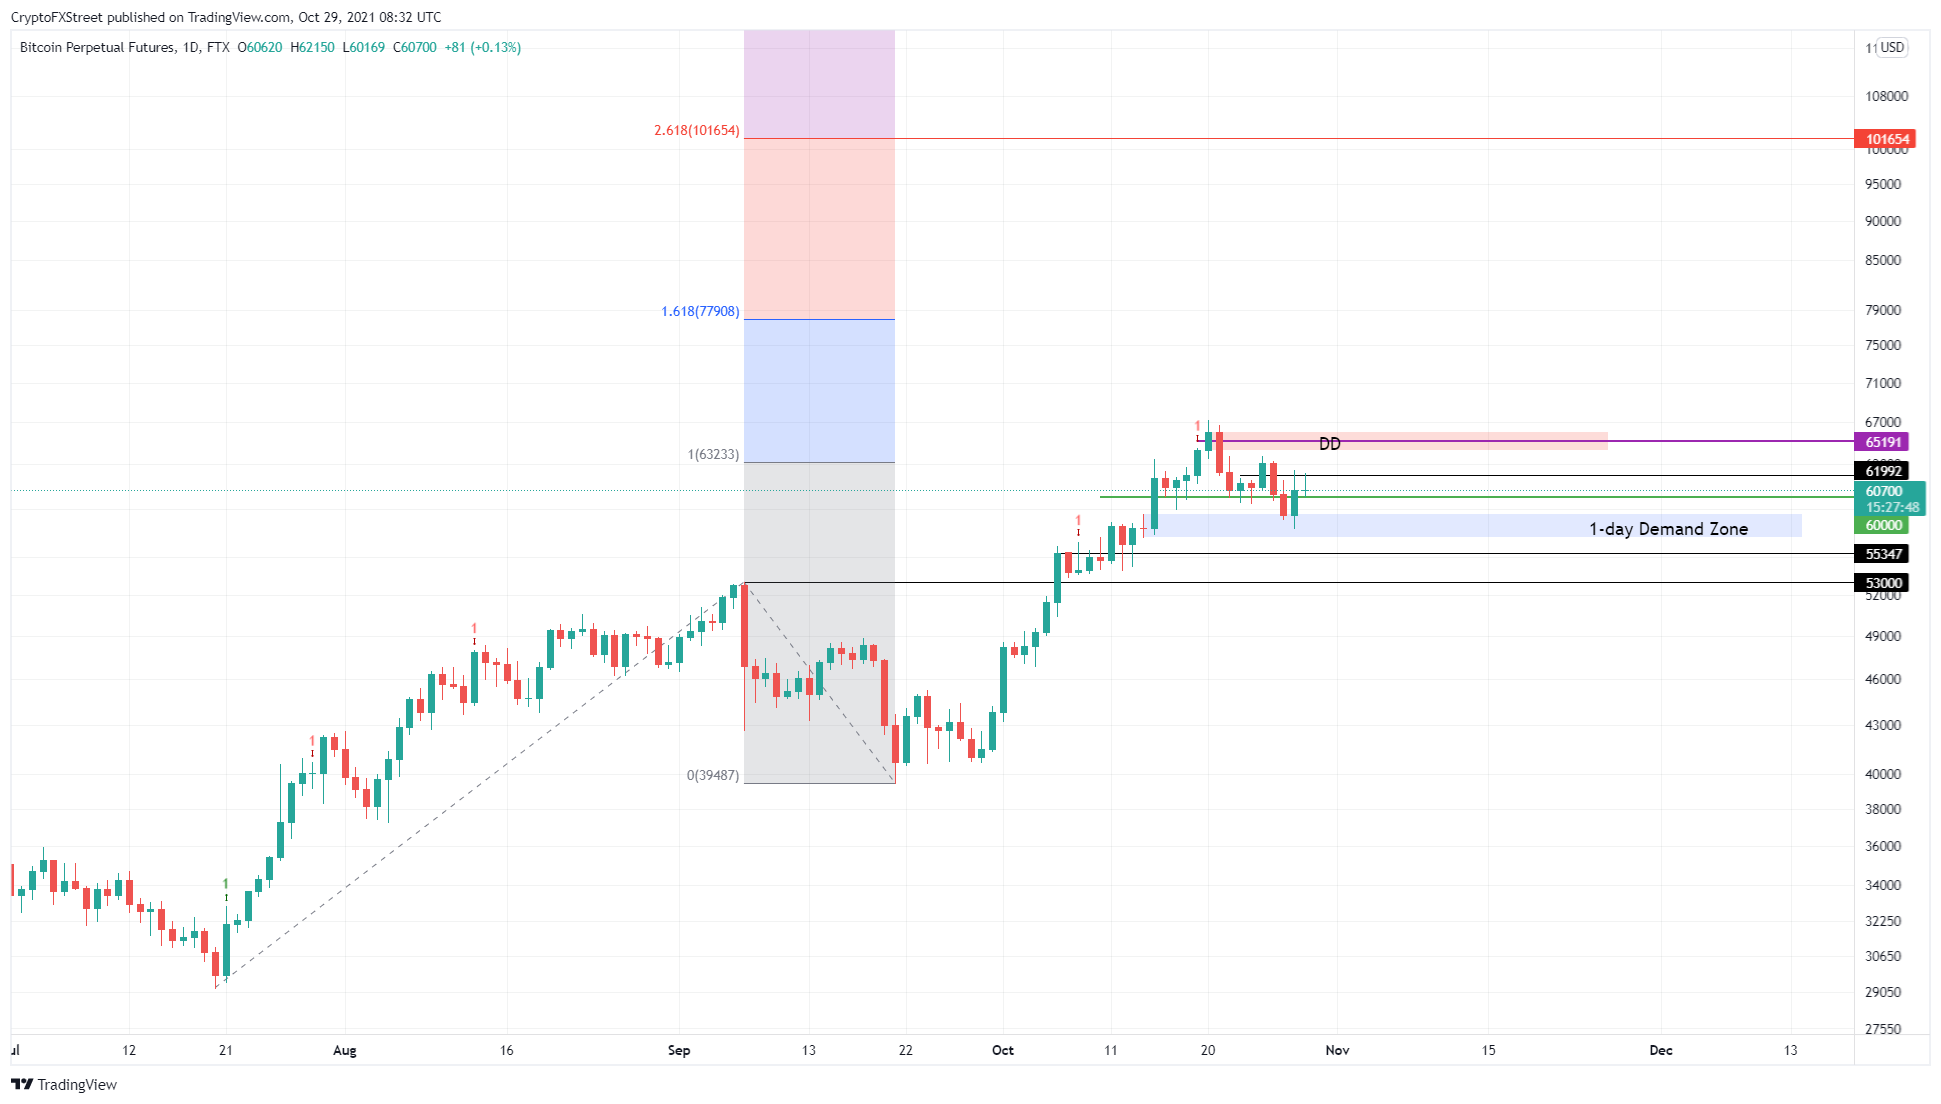
BTC/USDT 1-day chart
On-chain metrics reveal short-term correction
The Daily Active Addresses (DAA) for Bitcoin saw a slump from October 21 to October 28, creating a lower low. This downswing in DAA suggests that users interacting with the Bitcoin blockchain are decreasing, suggesting that capital is leaving the Bitcoin markets.
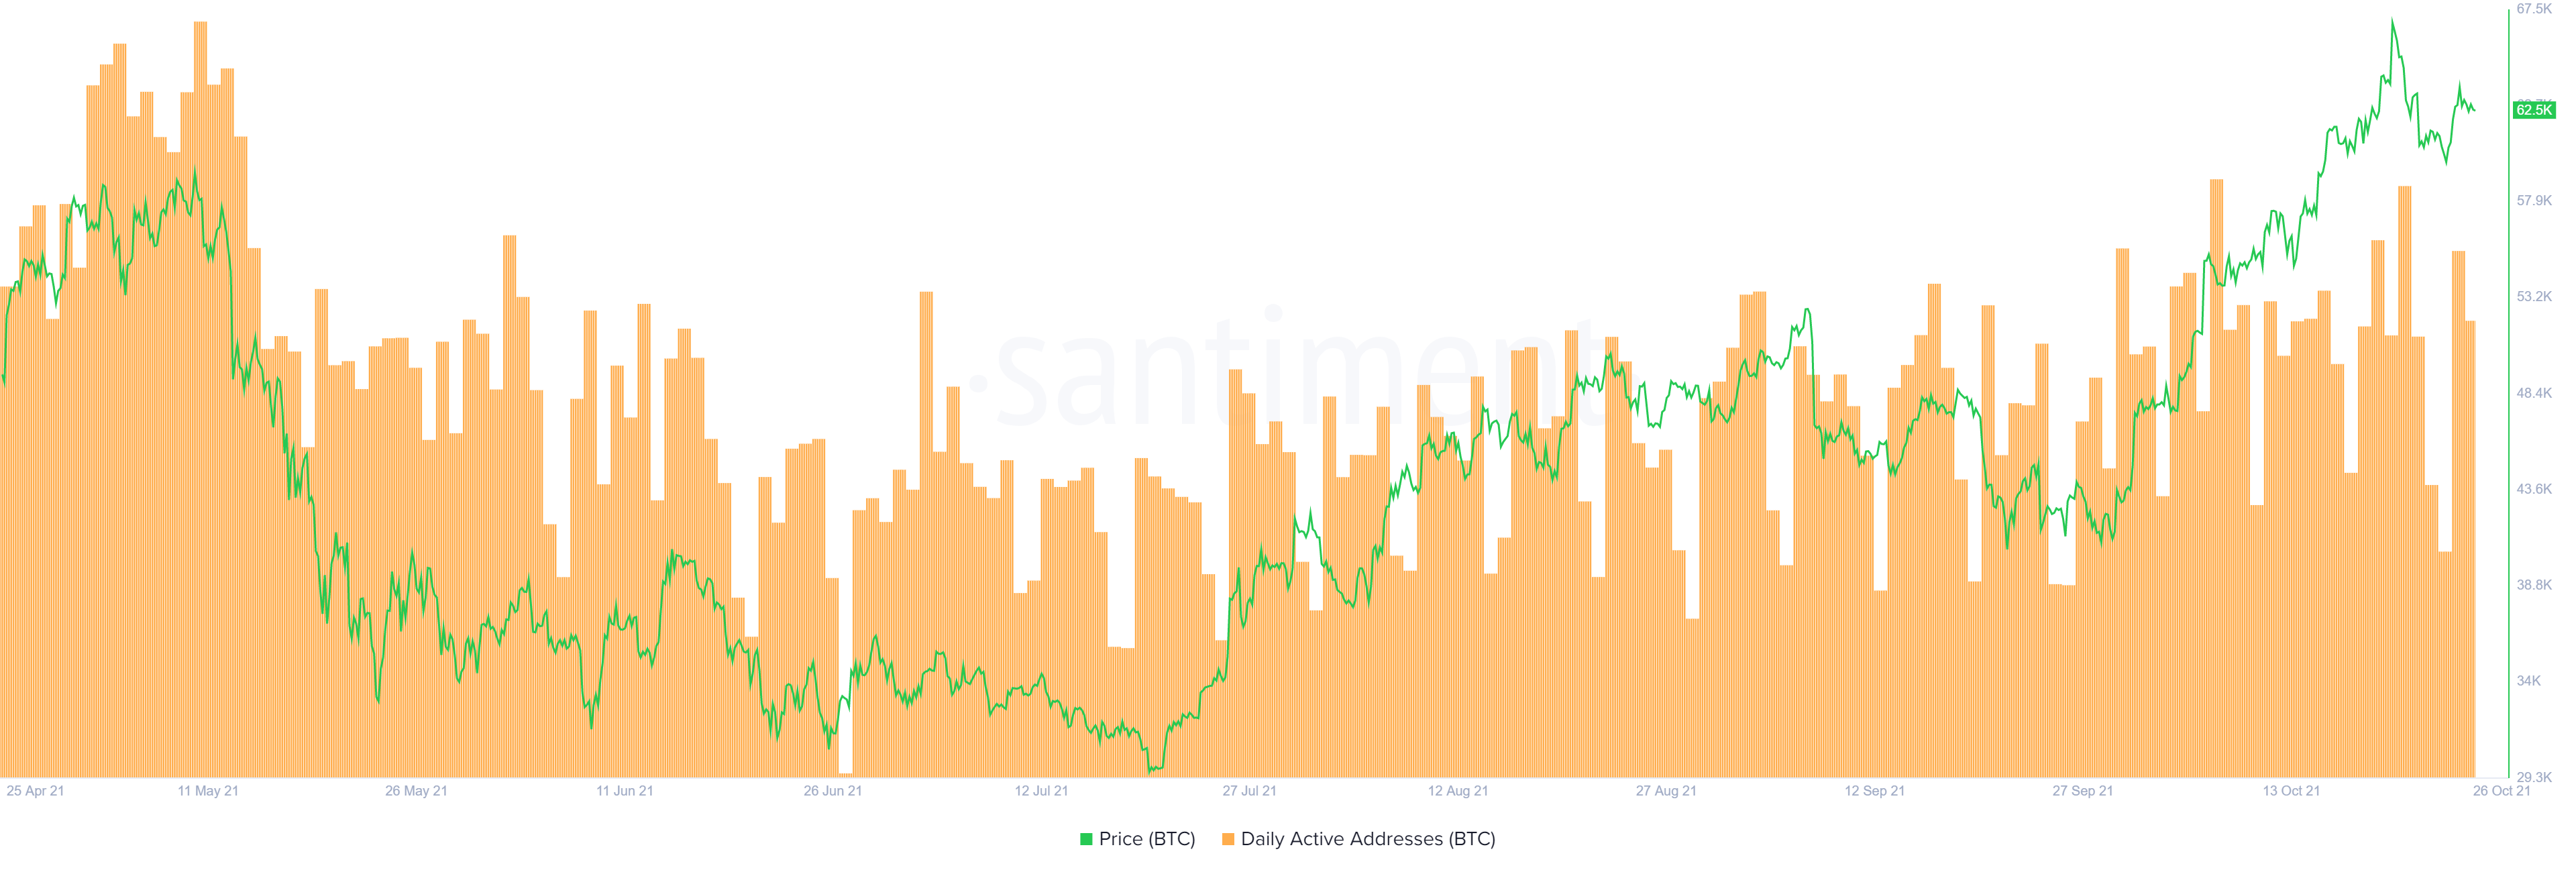
BTC DAA chart
The 365-day Market Value to Realized Value (MVRV) is hovering around 37%, suggesting that a sell-off is waiting to happen. This on-chain metric is used to determine the average profit and loss of investors that purchased BTC over the past year.
A higher number suggests that a large portion of the holders are in profit and could forego their assets to book profits triggered a Bitcoin crash. Therefore, investors need to be aware of the risk of a short-term correction that resets the 365-day MVRV.
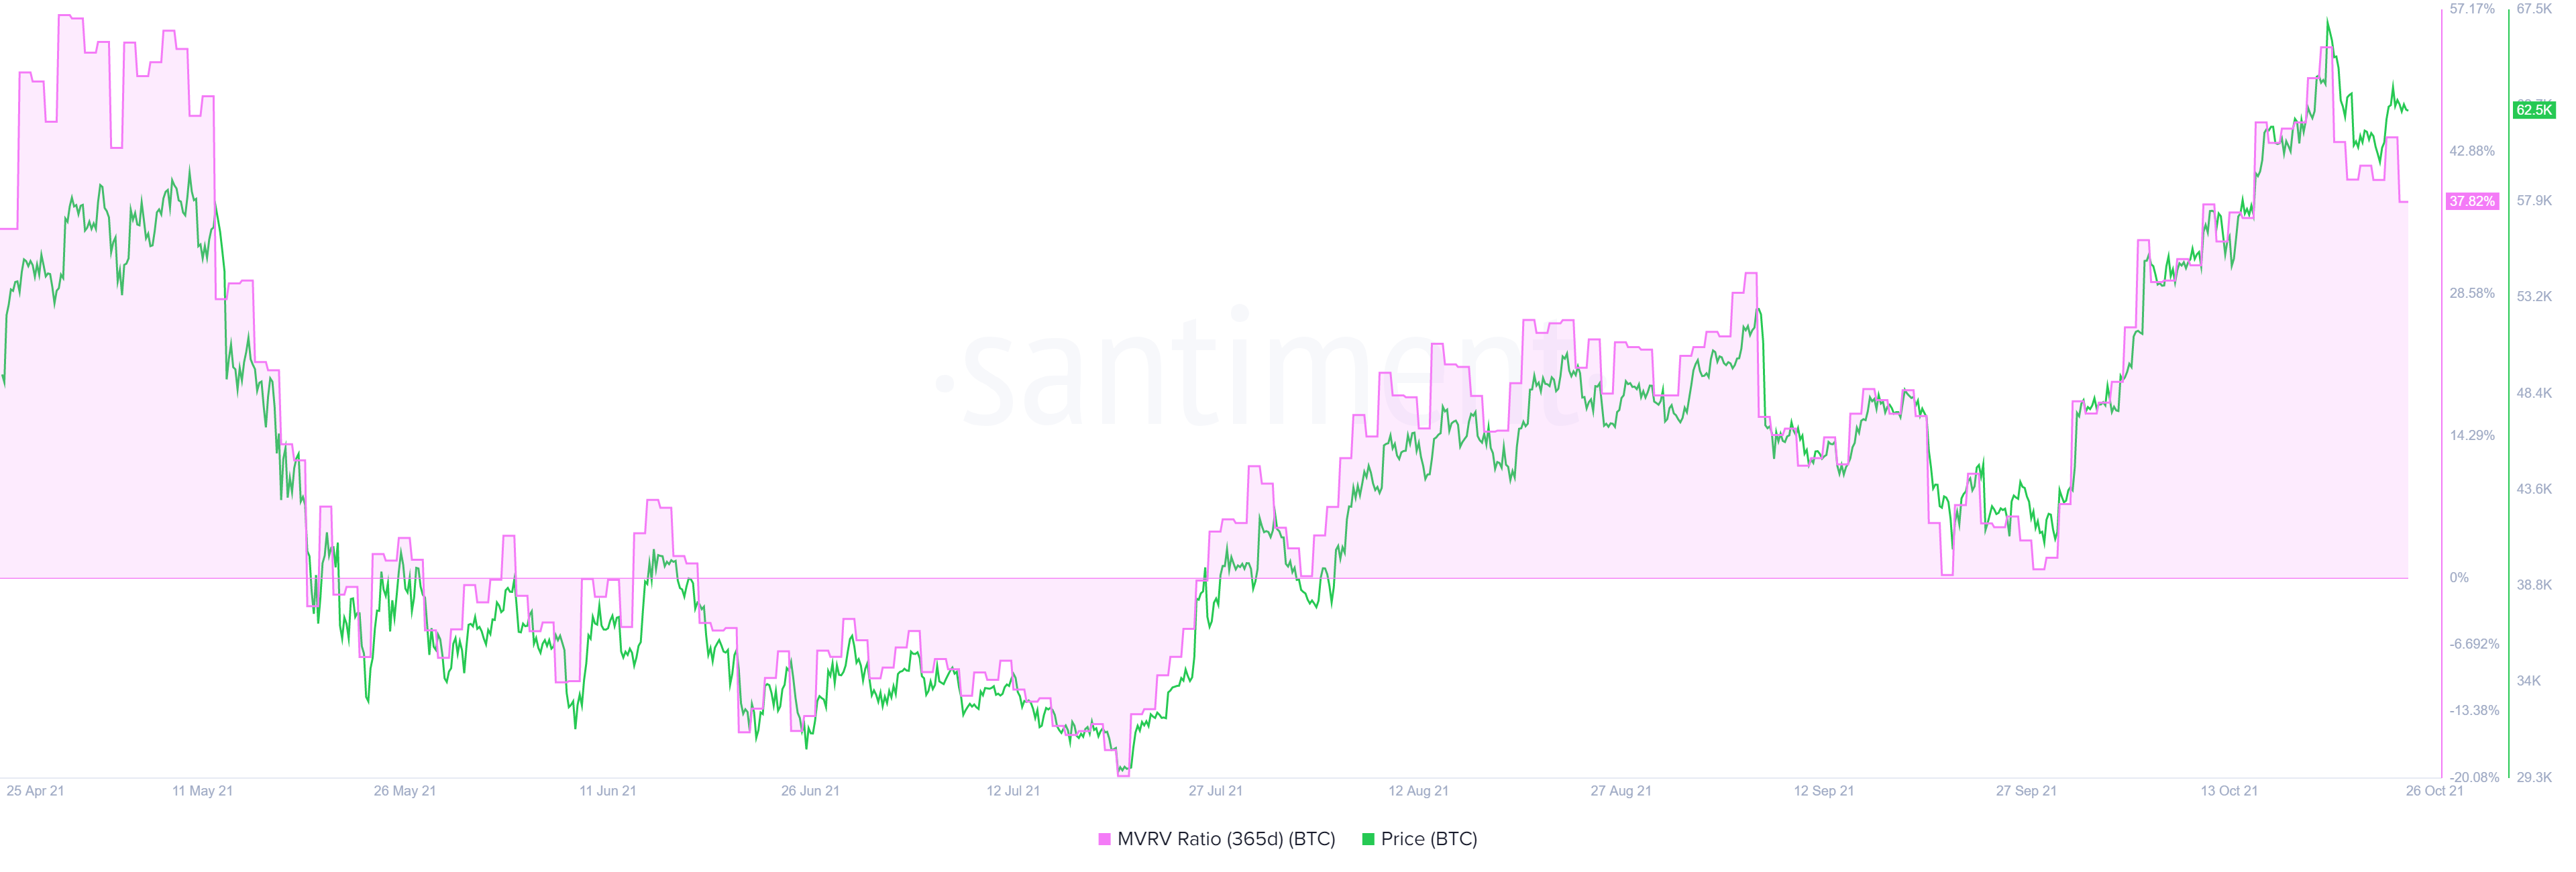
BTC 365-day MVRV chart
The funding rates for Bitcoin markets are hovering around 0.02%, suggesting that the markets are over-leveraged. Hence, a short-term correction will liquidate the high leverage players, bringing the funding rate down.
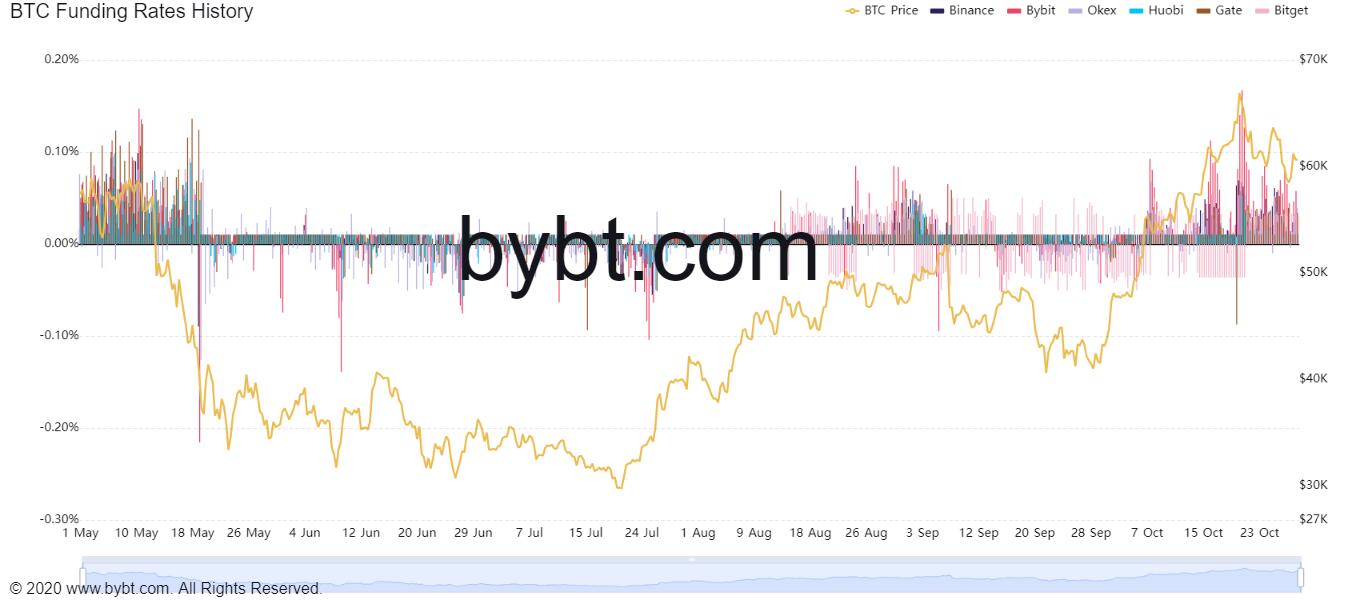
BTC funding rate chart
Open interest for Bitcoin is at around $26 billion, the same level as it was during its all-time high in May. Combining this data with the funding rate and other metrics reveals that the big crypto is due for a short-term correction.
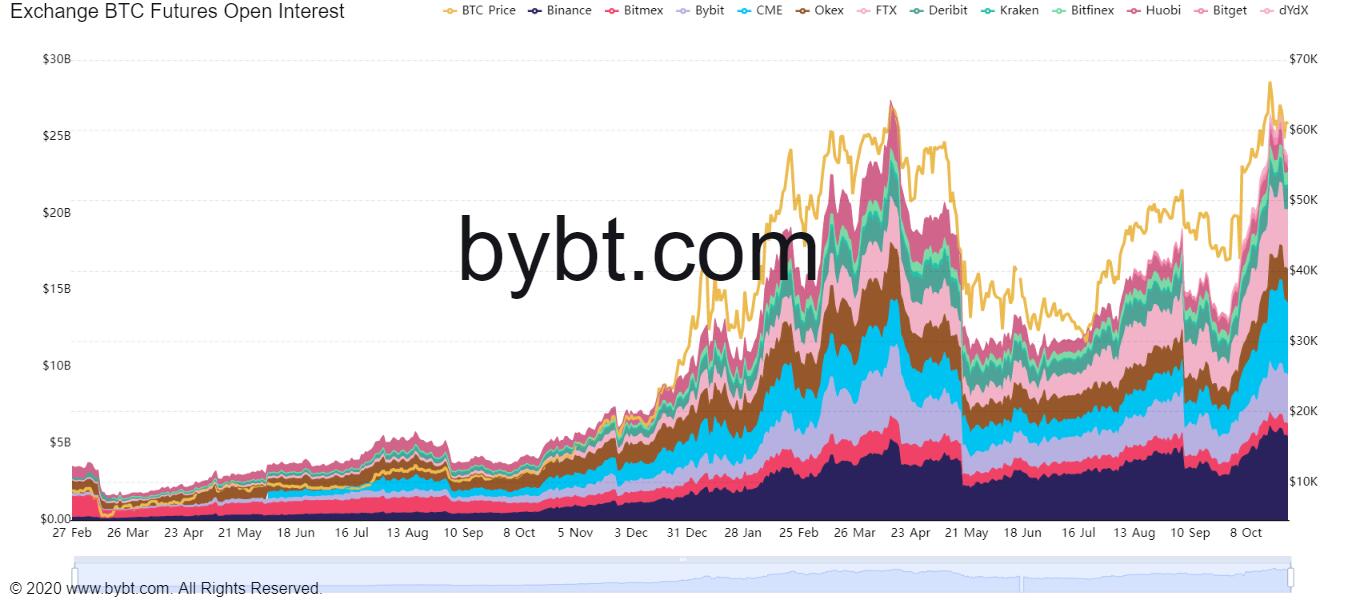
BTC open interest chart
While these on-chain metrics forecast that a short-term correction is plausible, the supply on exchanges on-chain metric shows that almost 60,000 Bitcoins have left centralized exchanges.
This move from long-term holders suggests that the correction explained above is nothing but a short-term blip that will not matter in the long run.
Therefore, the big picture of Bitcoin remains bullish.
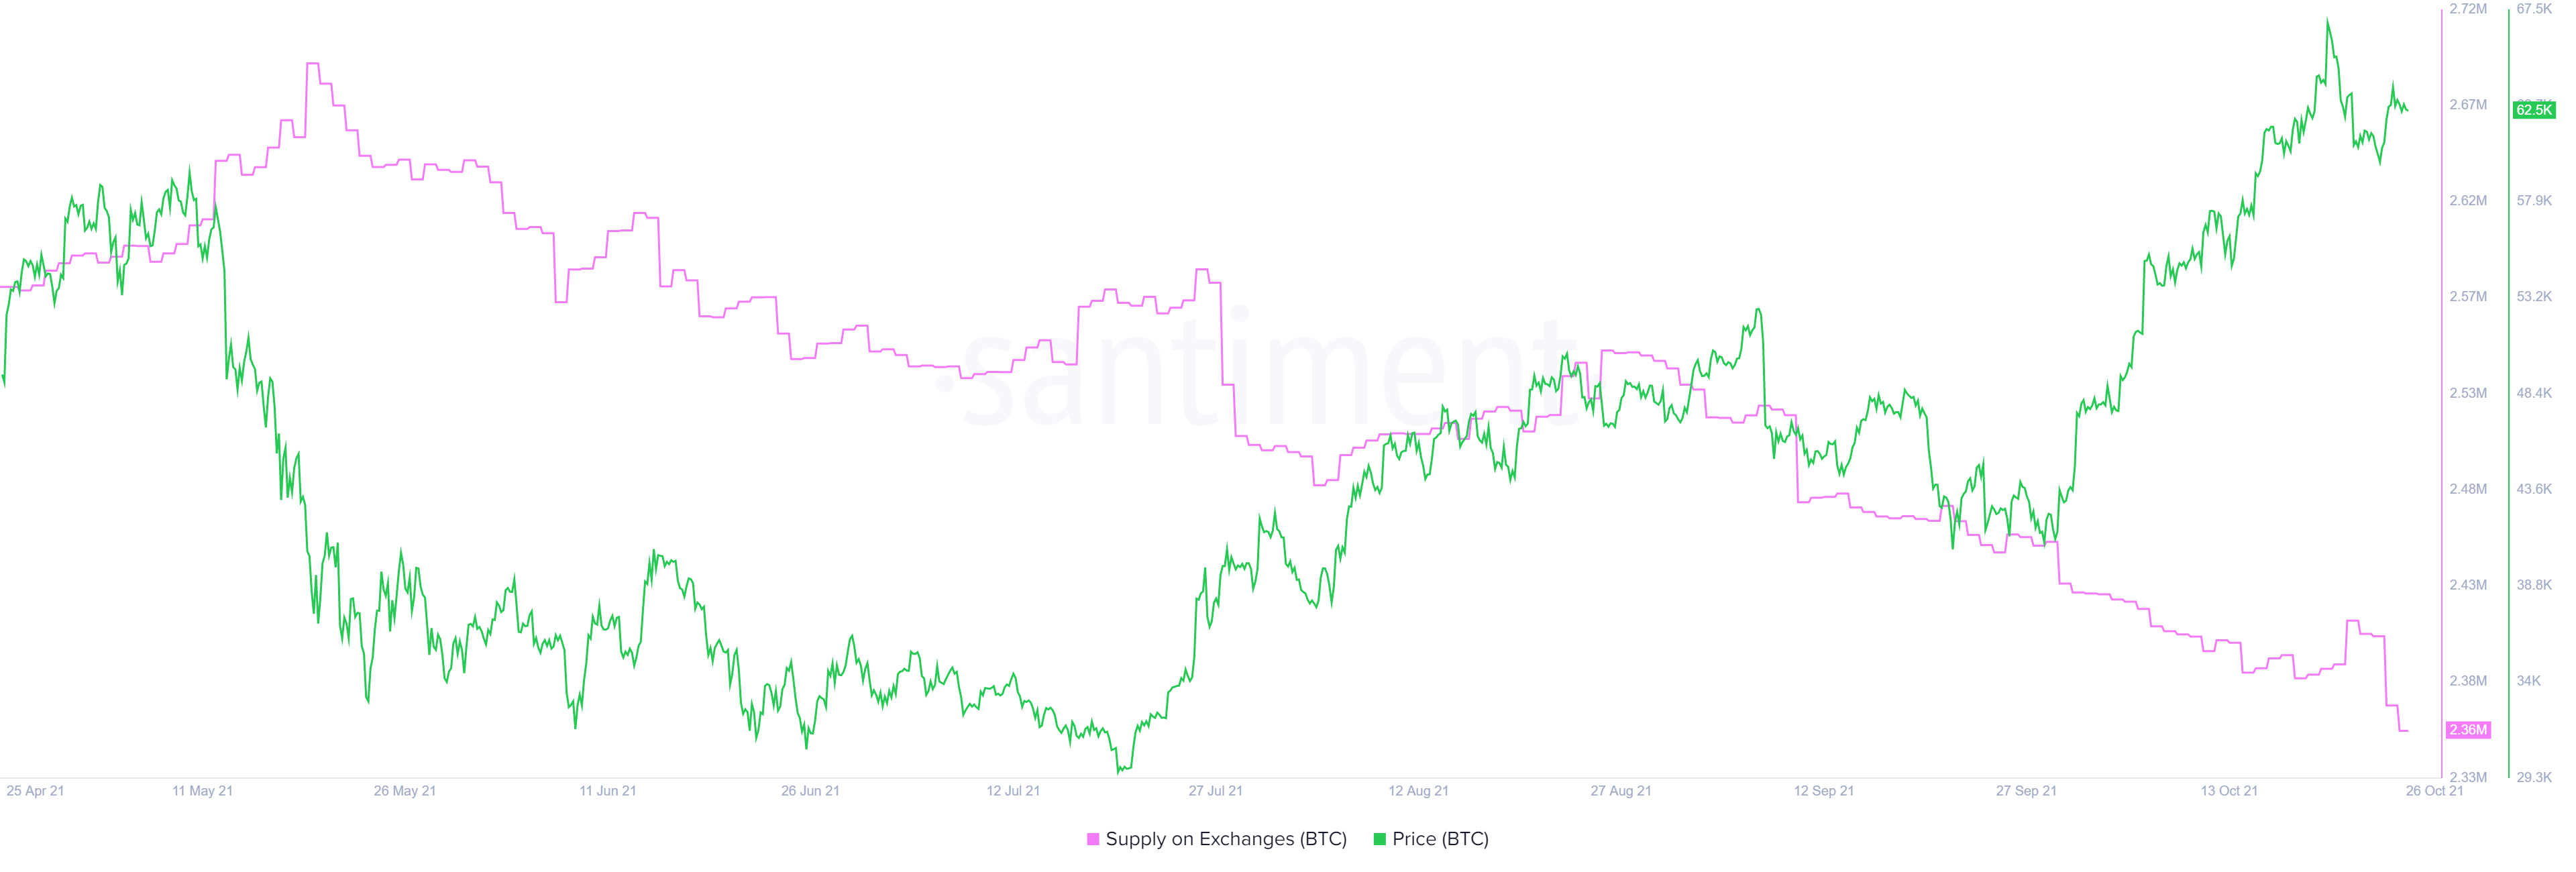
BTC supply on exchanges chart
On the other hand, if Bitcoin price produces a daily close above $62,000, it will indicate that the short-term bearish outlook will face invalidation. To restart the bull run, BTC needs to produce a daily close above $65,191.
In such a case, the big crypto will head toward $77,908 and higher. On the downside, if Bitcoin price shatters the $53,000 support level, it will head south toward $48,000, where demand will probably come in for another attempt at a bull run.
Author

Akash Girimath
FXStreet
Akash Girimath is a Mechanical Engineer interested in the chaos of the financial markets. Trying to make sense of this convoluted yet fascinating space, he switched his engineering job to become a crypto reporter and analyst.


