Top 3 Price Prediction Bitcoin, Ethereum, Ripple: Crypto markets retain optimism despite the recent crash
- Bitcoin price loses directional bias as it revisits the $60,000 support floor.
- Ethereum price follows suit and comes close to retesting the $4,000 psychological level.
- Ripple price anticipates a bounce from the $1.01 to $0.96 support area.

Bitcoin price is in a suspended state as it grapples with a crucial psychological level. A make-or-break situation develops for altcoins as Ethereum and Ripple follow suit.
Bitcoin price attempts to reestablish a bias
Bitcoin price has dropped 15% since setting up a new all-time high at $69,000 on November 10. This drop has sliced through the $60,000 psychological level multiple times and is currently exploring the possibility of a further drop. The 1-day demand zone, ranging from $58,100 to $60,331, is the next crucial support that will decide the fate of the big crypto.
A successful bounce will indicate that the recent crash was just an unfortunate turn. In such a scenario, BTC will retest the $63,757 resistance barrier, followed by a move toward the all-time high with hopes of pushing higher to a new one.
Assuming the bullish momentum continues to increase, BTC is likely to head to the 161.8% Fibonacci extension level at $77,525.
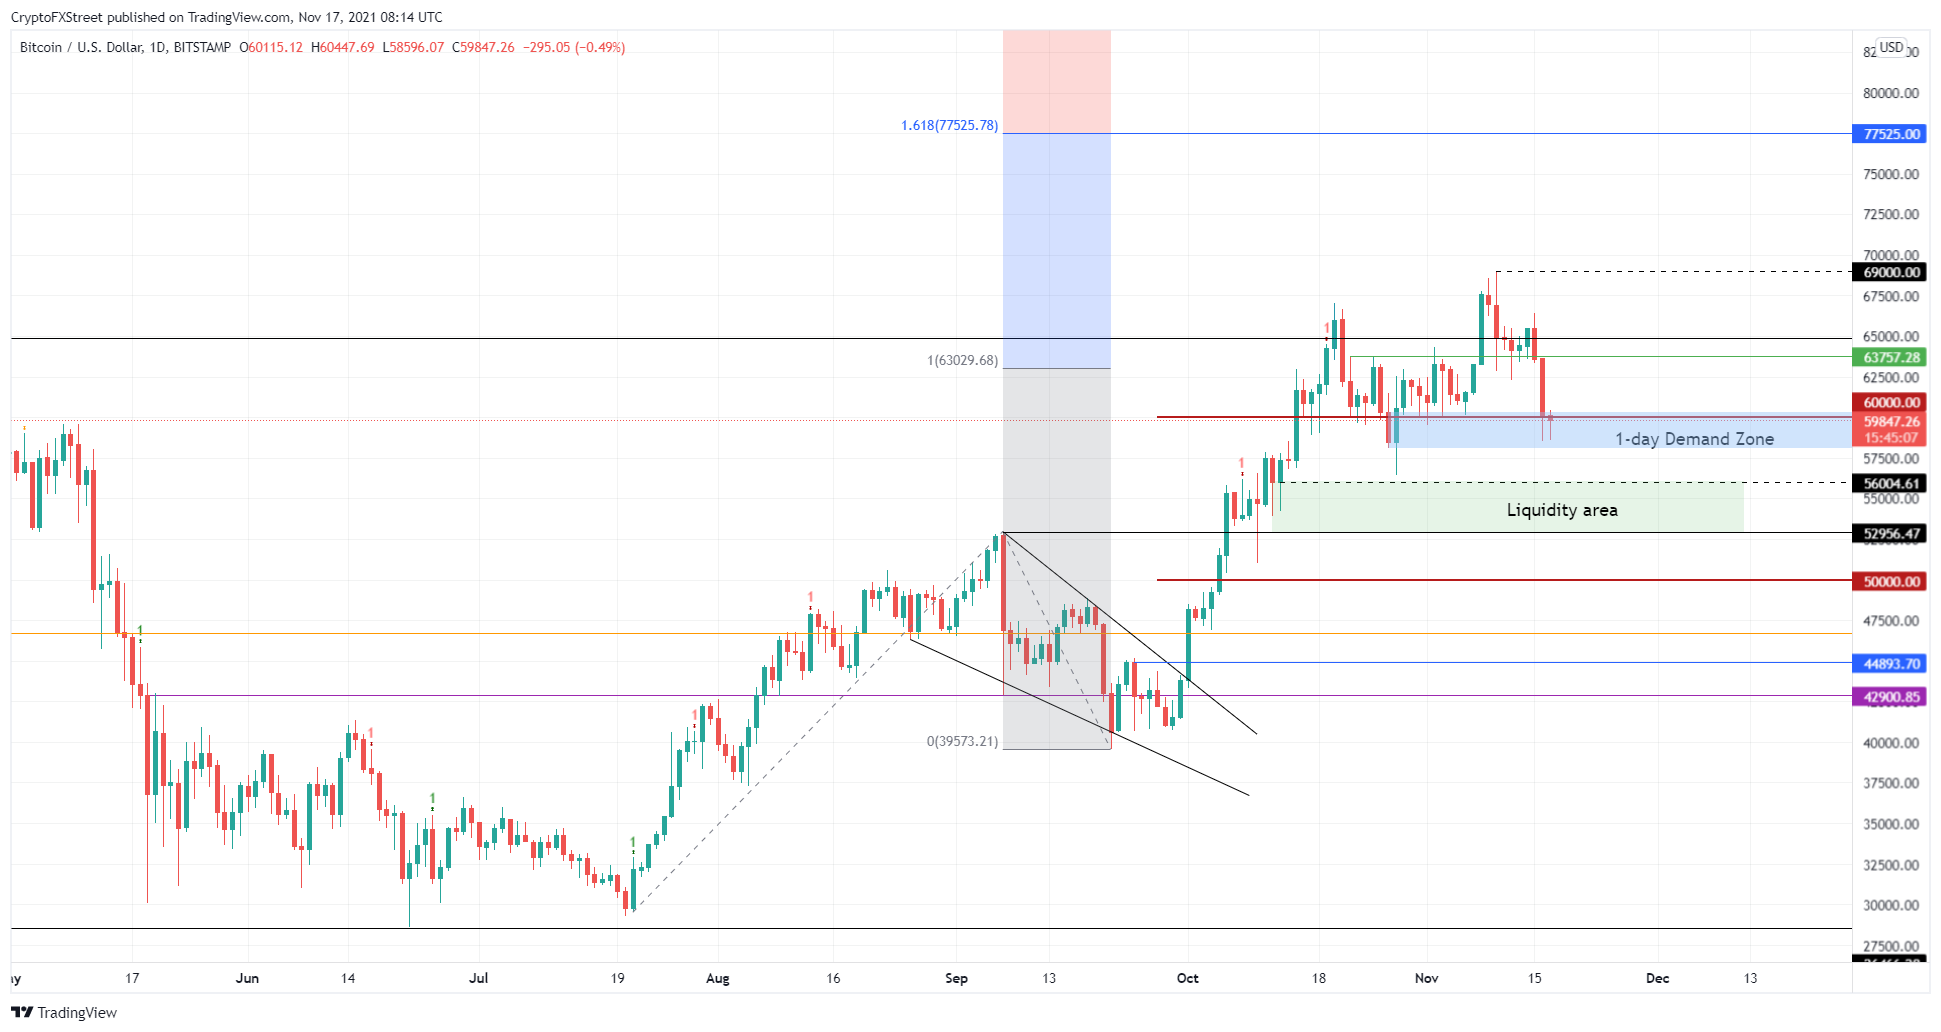
BTC/USD 1-day chart
The above bullish narrative assumes that Bitcoin price will bounce off the $58,100 to $60,331 demand zone, however, a breakdown of this level will suggest that BTC could head into a liquidity area, ranging from $52,899 to $56,046.
Ethereum price in search of stable support
Ethereum price dropped 15% since November 15 and is currently hovering above the $4,000 psychological barrier. This downswing is a much-needed reset that allows buyers to book profits and sidelined investors an opportunity to jump on the bandwagon.
Market participants can expect ETH to rally to $4,500 in the short-term before it grapples with the all-time high at $4,875. A daily close above this barrier will allow ETH to retest the $5,000 psychological level.
In a highly bullish case, Ethereum price could also extend the run-up to the following meaningful levels at $5,500 and $6,000.
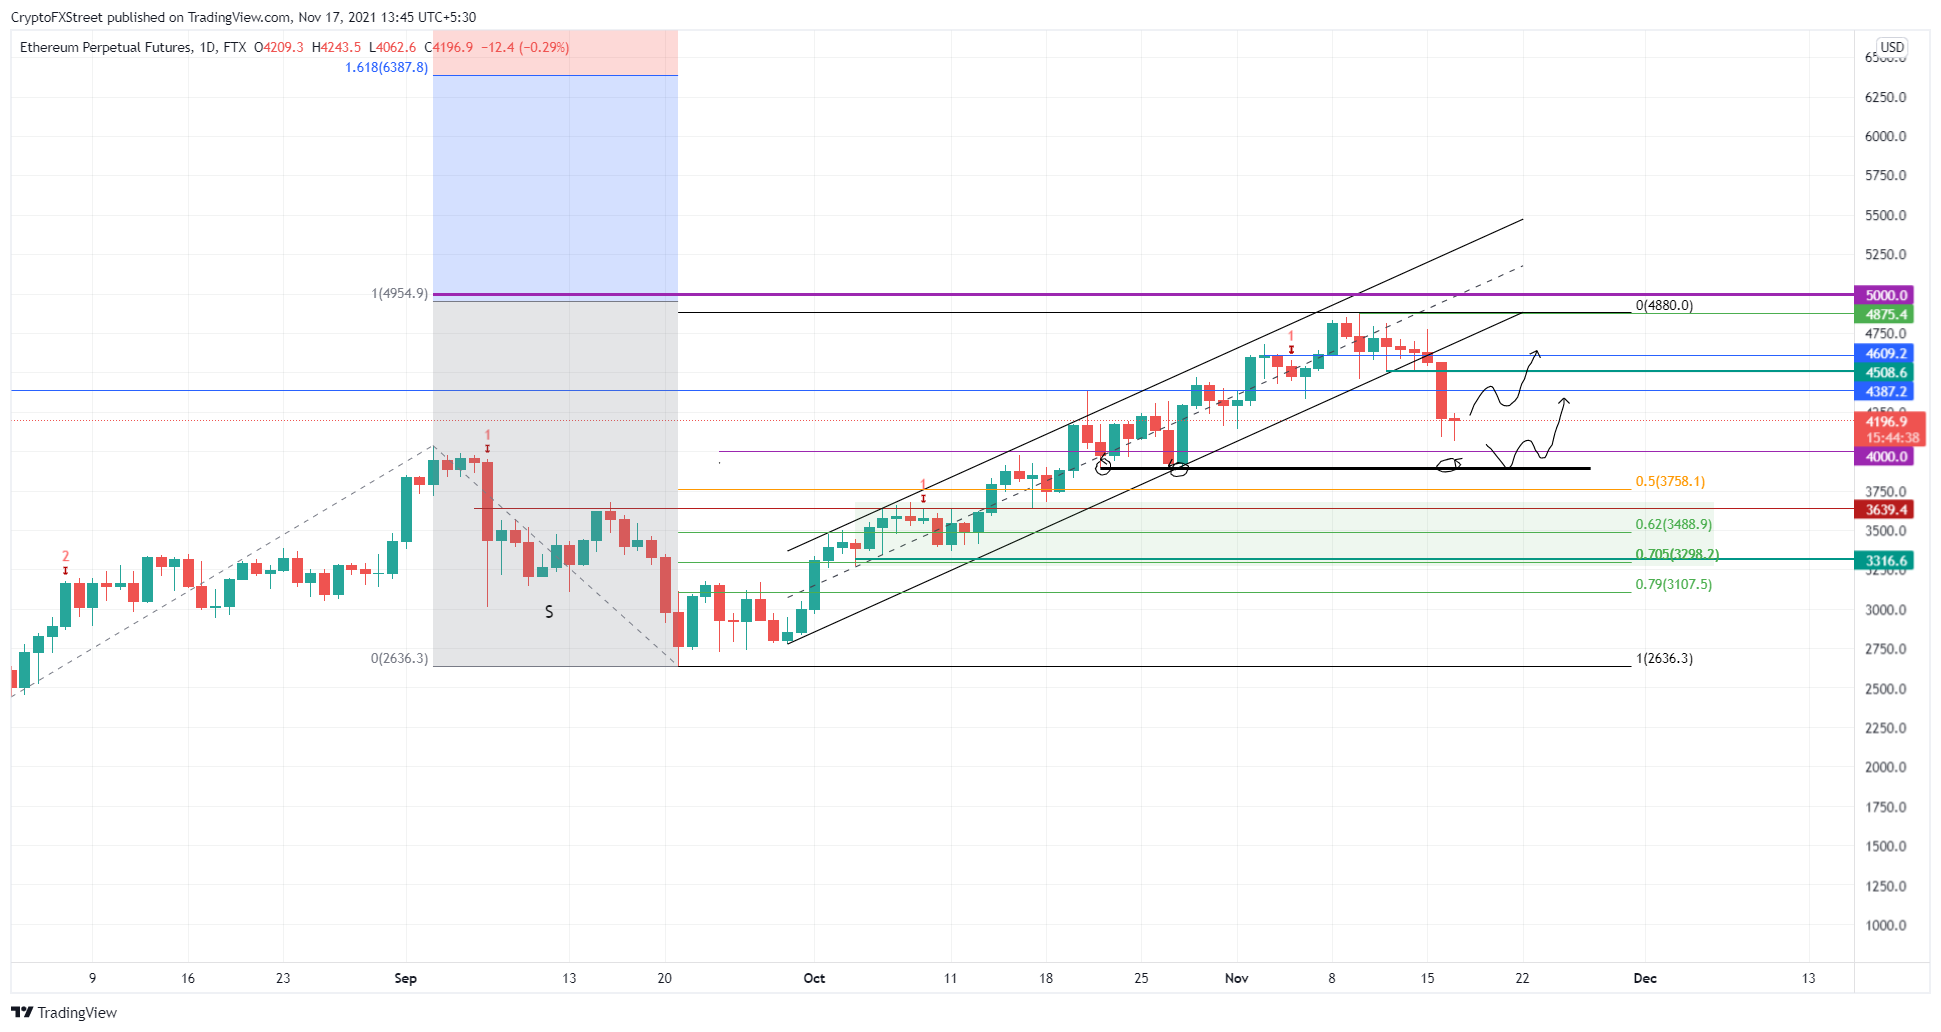
ETH/USD 1-day chart
Although Ethereum price failed to retest the $4,000 psychological level, a failure to move past the $4,500 level will indicate weakness and is likely to trigger a correction. If the resulting pullback produces a lower low below $4,000, it will invalidate the bullish thesis.
Ripple price could head lower
Ripple price has been in an uptrend for the last two months and has set up three higher highs and four lower lows. Connecting these swing points using trend lines results in an ascending parallel channel.
This technical formation forecasts a bearish breakout. Therefore, a daily close below $1.09 will indicate a breakout and suggest that the XRP price is likely to revisit the $1 psychological level. In a highly bearish case, it could find support on the $0.77 to $0.84 demand zone.
Unlike Bitcoin or Ethereum, Ripple price has been underperforming and could slide lower.
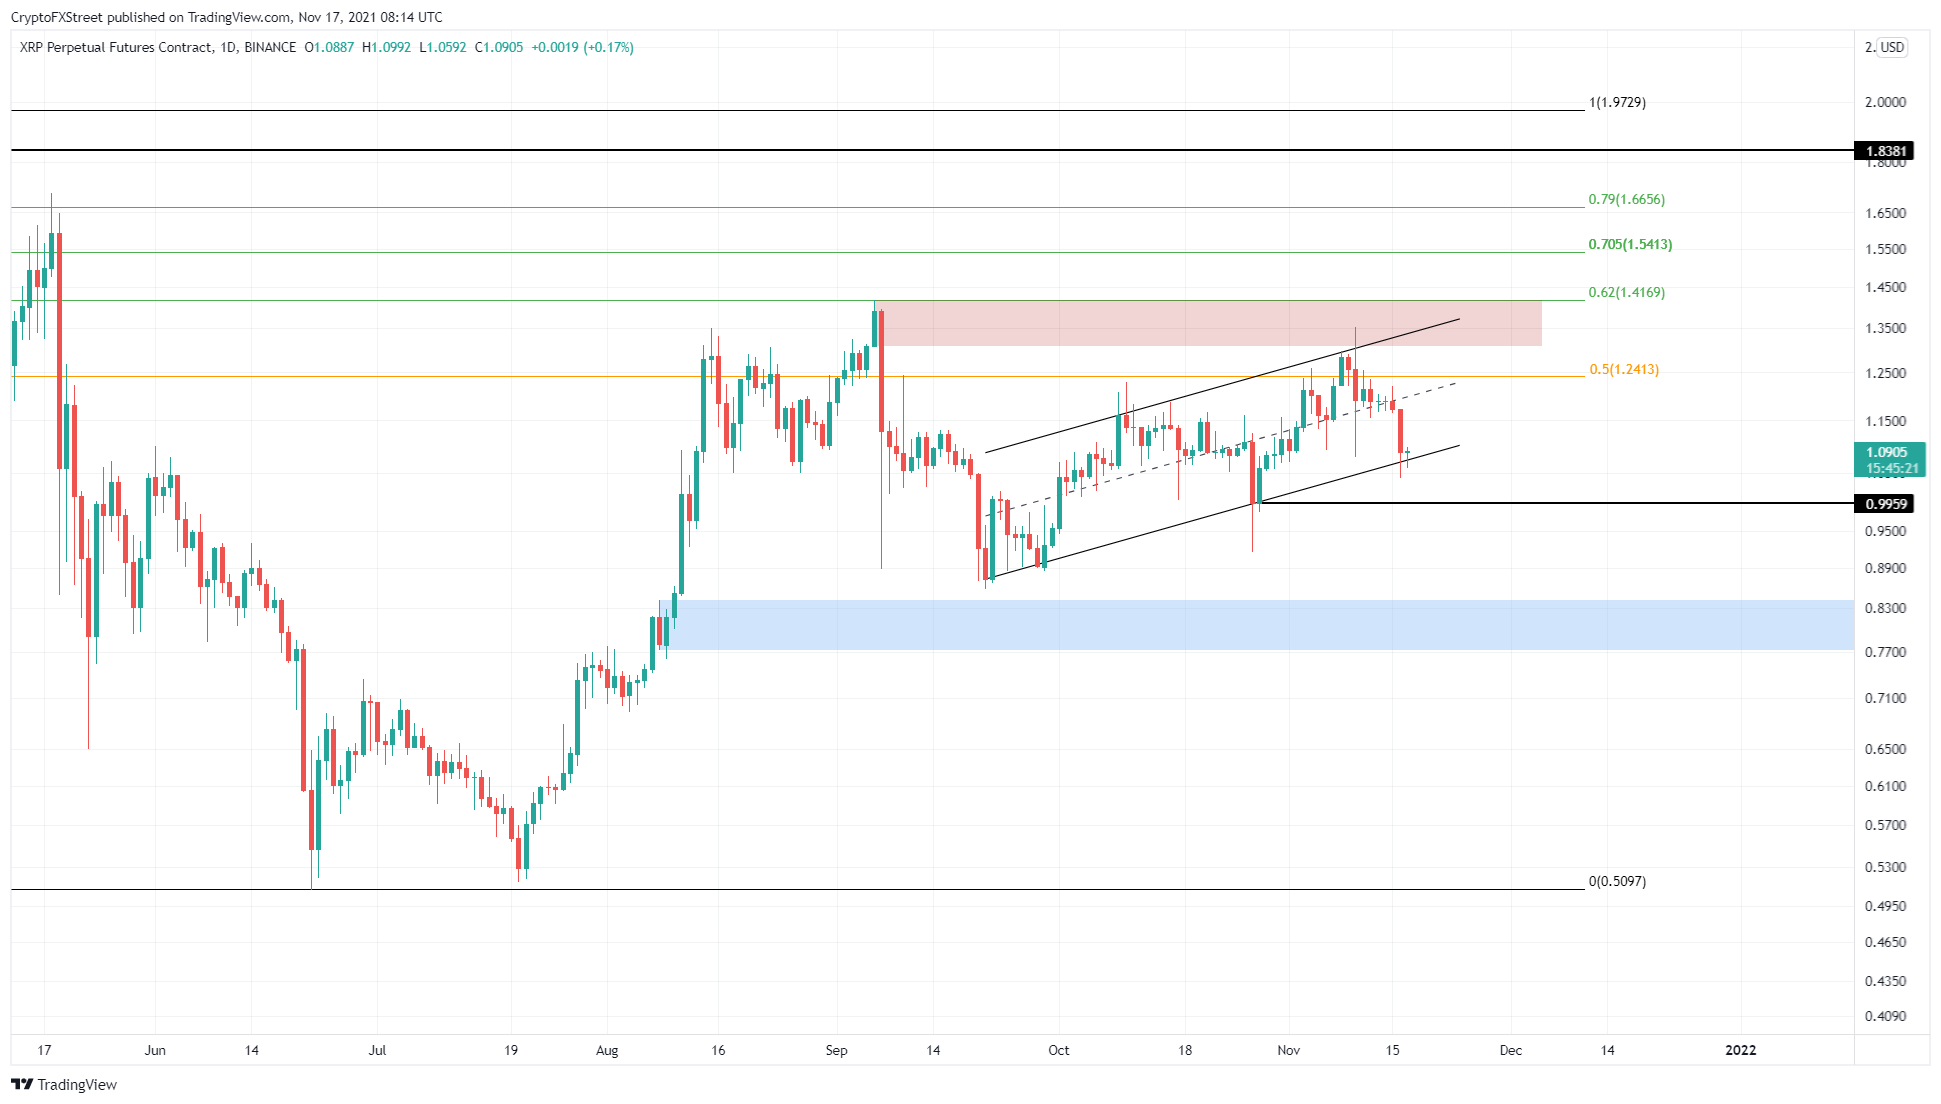
XRP/USD 1-day chart
On the other hand, if Ripple price manages to stay inside the channel’s lower trend line, it will indicate that a 14% upswing to revisit the 50% retracement level at $1.24 is likely. A daily close above the $1.41 resistance barrier will invalidate the bearish thesis.
Author

Akash Girimath
FXStreet
Akash Girimath is a Mechanical Engineer interested in the chaos of the financial markets. Trying to make sense of this convoluted yet fascinating space, he switched his engineering job to become a crypto reporter and analyst.


