Top 3 Price Prediction Bitcoin, Ethereum, Ripple: Crypto market aims for further gains as new bullish cycle begins
- Bitcoin renews the uptrend above $18,000, temporarily invalidating the bearish case to $16,500.
- Ethereum has topped $500 for the first time since July 2018 in readiness for the upswing to $520.
- Ripple reclaims the position above $0.3 after it bounced from the support at $0.28.

The bull cycle in the cryptocurrency market seems poised to take matters to the next higher level. Over the last 24 hours, crypto assets in the top ten have posted considerable gains, with Litecoin (LTC) and Polkadot emerging the biggest gainers.
Bitcoin has not been left behind either, especially now that it has reclaimed the ground above $18,000. Ethereum is up 4% over the last 24 hours to exchange hands at $492. On the other hand, Ripple is battling the uphill task of regaining the position above $0.3.
Bitcoin is on the cusp of another breakout
Bitcoin is trading at $18,216 after making a remarkable recovery above the critical $18,000 level. The flagship cryptocurrency's bearish outlook to $16,500 discussed on Thursday was invalidated, allowing bulls to assume control over the price.
For now, the path of least resistance appears to be to the upside and has been reinforced by the Relative Strength Index renewed uptrend towards the overbought territory. An incoming constriction of the Bollinger Bands hints at a possible breakout.
If Bitcoin closed the day above $18,500, more buy orders are likely to come into the picture, as investors anticipate new yearly highs above $19,000.
 (66)-637414619456894997.png)
BTC/USD 4-hour chart
On the flip side, closing the day underneath the Bollinger Bands' middle boundary may culminate in a 50 Simple Moving Average breakdown. If Bitcoin slides further, panic selling and the rush to cash out for profit could drive it to the 100 SMA and the 200 SMA.
Ethereum tops $500 for the first time since July 2018
The smart contract giant is about to flip $500 into support after brushing shoulders with the level for the first time since July 2018. Our predictions have suggested that Ethereum is on a trajectory to $520, perhaps before ETH 2.0 launches, which might elevate it to $900.
At the time of writing, ETH/USD is trading at $498 while battling the seller congestion at $500. The ongoing bullish momentum has been validated by a breakout above the ascending parallel channel. If Ether closes the day above $500, the next rendezvous for the bulls would be $520. Here, they will work on a plan to lift the token to a higher price level.
 - 2020-11-20T114832.155-637414619993335744.png)
ETH/USD 4-hour chart
On the other hand, if the resistance at $500 remains intact, Ethereum may lose traction and slide back into the channel. An increase in selling pressure is likely to send ETH/USD downstream towards $480, the 50 SMA and 100 SMA, marginally above $450.
Ripple reclaims position above $0.3
XRP is sitting above $0.3 after recovering from the accelerated ascending trendline support in conjunction with the buyer congestion at $0.28. It is not certain that Ripple will continue with the uptrend to $0.31 but holding above $0.3 would be a bullish sign.
All the three applied moving averages, the 50 SMA, 100 SMA and 200 SMA, are trying to catch up with the up-trending price, which is another bullish indicator. Moreover, the RSI is not oversold at the moment, presenting room for growth.
 (3)-637414620598531371.png)
XRP/USD 4-hour chart
The TD Sequential indicator has just presented a sell signal on the daily chart, which might invalidate the bullish outlook. The sell signal manifested in a green nine candlestick. Usually, if validated, this signal could see the price fall in one to four daily candlesticks.
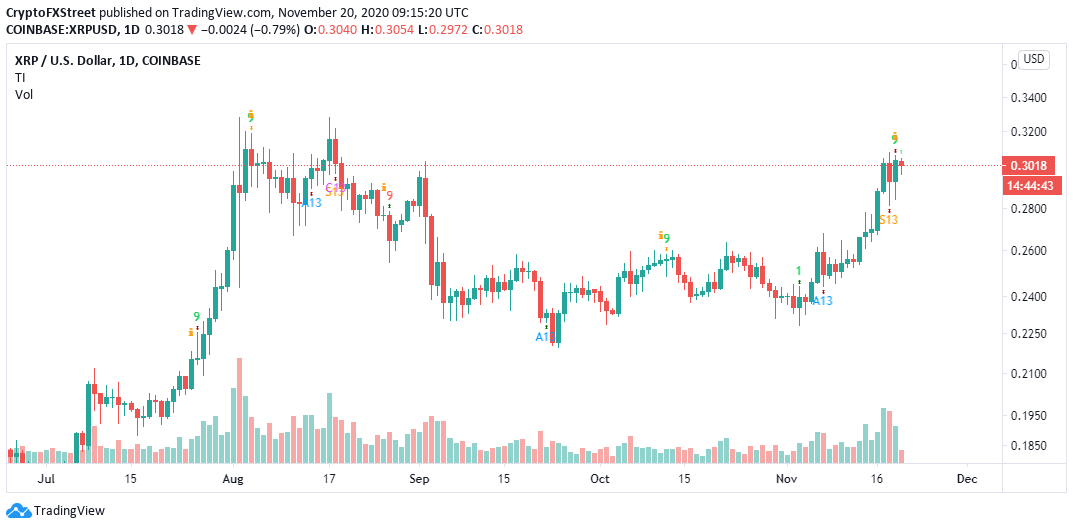
XRP/USD daily chart
Simultaneously, if XRP fails to hold the ground above $0.3, bears will likely start exploring the rabbit hole towards $0.22. The recent support at $0.28 (50 SMA) will come in handy when stopping declines. Other key levels traders can keep in mind are the main ascending trendline, the 100 SMA and the 200 SMA.
Author

John Isige
FXStreet
John Isige is a seasoned cryptocurrency journalist and markets analyst committed to delivering high-quality, actionable insights tailored to traders, investors, and crypto enthusiasts. He enjoys deep dives into emerging Web3 tren



