Top 3 Price Prediction Bitcoin, Ethereum, Ripple: Central bankers downplay cryptos as market consolidates
- Bitcoin price momentum continues to fail at 200-day simple moving average (SMA), constructing symmetrical triangle.
- Ethereum price momentum stalls at the tactically important 50-day SMA, but overall price structure remains positive.
- XRP price drops below neckline of a head-shoulders pattern on the four-hour chart, introducing new short-term risk.

Bitcoin price construction of a symmetrical triangle does point to a period of uncertainty. In contrast, XRP price is overcome with selling pressure, leaving it exposed to a test of the crash lows. Ethereum price seeks consolidation to release burdensome price compression before seeking new rally highs.
Kuroda joins the ranks of central bankers questioning cryptocurrencies
Not to be left out of the picture, Bank of Japan Governor Haruhiko Kuroda interjected into the conversation about Bitcoin and digital assets in general. He said that “most of the trading is speculative and volatility is extraordinarily high,” while the bellwether cryptocurrency is scarcely used as a settlement currency.
Kuroda’s comments follow the European Central Bank Vice President, Luis de Guindos. Guindos warned on May 19 that digital assets like Bitcoin should not be considered a real investment because the underlying value is difficult to define and BTC regularly undergoes periods of intense volatility.
This is an asset with very weak fundamentals and that is going to be subject to a lot of volatility.
On May 13, the Bank of England governor Andrew Bailey warned that the aggressive search for yield in the cryptocurrency complex was a “warning sign” and that Bitcoin had no intrinsic value to justify the elevated price levels.
In March, Federal Reserve Chairman remarked that digital assets were not a store of value because they were not backed by anything. Instead, they were a substitute for gold rather than the dollar.
Crypto assets are highly volatile — see Bitcoin — and therefore not really useful as a store of value. They’re not backed by anything. They’re more of an asset for speculation.
The rally in the cryptocurrency since March 2020 and, in particular, from the beginning of 2021 has elevated the space into the broader investment conversation. Still, it has not served as a breakthrough moment in changing the opinions of central bank leaders. Overall, monetary authorities remain cryptocurrency adverse, as exemplified by last week’s crackdown in China.
As long as the legal fate and classification of digital assets remain ambiguous in most countries, Bitcoin will be categorized as a vehicle of speculation by the major central banks rather than a store of value and prominent payment mechanism for global commerce.
Bitcoin price is met by a wall of resistance
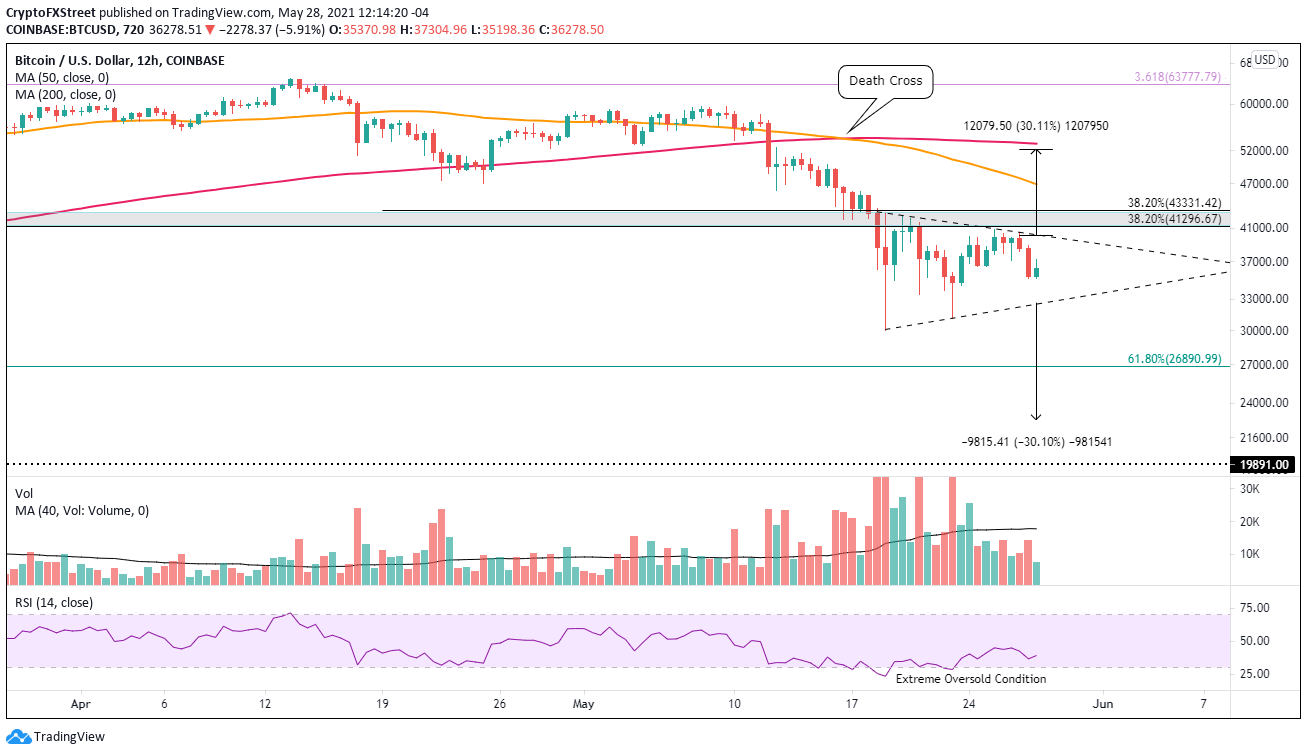
Bitcoin price is currently defining a symmetrical triangle on the charts, with price nearing the middle of the pattern. A symmetrical triangle is formed by two converging trend lines that come together on the right, forming the triangle’s apex. Volume tends to diminish as the triangle develops, and there is seldom any clue given on the chart containing the triangle if prices are going to break down or up. Investors need to wait until the asset finally decides to resolve the pattern. The pattern embodies hesitancy, or a “triangular area of doubt,” according to Robert D. Edwards and John Magee.
The BTC symmetrical triangle lies below the intersection of multiple levels of resistance that will challenge Bitcoin price for days and possibly weeks to come if the triangle resolves to the upside. The resistance includes the 38.2% Fibonacci retracement of the historic rally from the March 2020 low to the April high at $41,581, the January 8 high at $41,986, the February 28 low at $43,016 and 38.2% retracement level of the April-May decline at $43,331.
The measured move of the BTC triangle is approximately 30%, creating an upside target of $52,309 from the current position of the triangle’s upper trend line, which coincides with the 200 twelve-hour SMA at $53,148. The downside target is $22,796 from the current position of the triangle’s lower trend line.
To reach the upside target, Bitcoin price will need to dismantle the resistance mentioned above and overcome the 50 twelve-hour SMA at $46,950.
BTC/USD 12-hour chart
Dominant levels do not overshadow the downside target of $22,796, but Bitcoin price will discover some support at the May 23 low at $31,111 and the May 19 low at $30,000. Additional support could emerge at the 61.8% retracement of the rally from March 2020 until the April high at $26,890.
It is important to note that the downside target for BTC is just above the 2017 high at $19,891.
Ethereum price pauses as compression releases
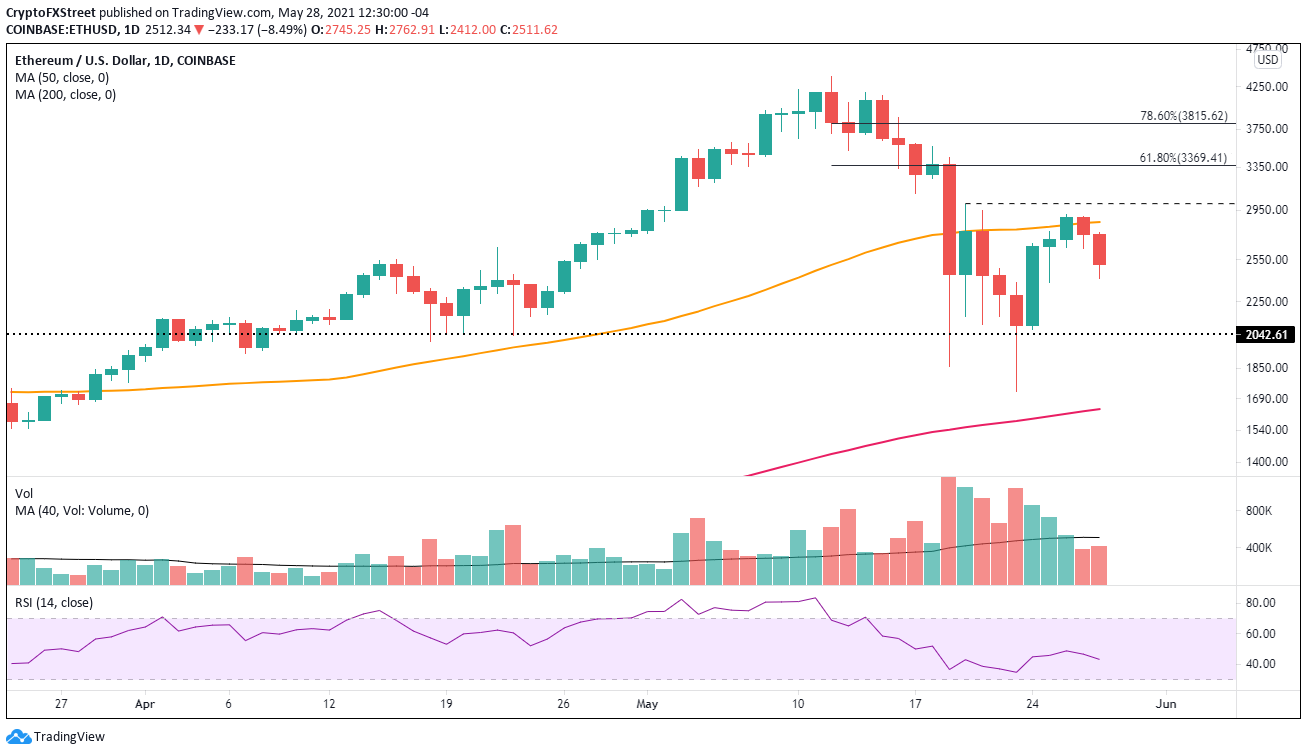
Ethereum price followed last week’s 41.44% decline with the largest daily advance since January 3. The feverish bounce lead by the 26.27% gain on May 24 quickly uncovered resistance at the 50-day SMA on May 26, causing a mild pullback over the last two days.
The rebound, initiated by a bullish hammer candlestick pattern on the 12-hour chart, has been accompanied by solid volume after reaching an oversold condition on the daily Relative Strength Index (RSI). Moreover, the May 23 undercut of the May 19 low has put Ethereum price in place for a double bottom pattern with a trigger price of $3,000.
A breakout above the double bottom trigger will quickly discover resistance at the 61.8% Fibonacci retracement of the May decline at $3,369. If the rally continues, Ripple will experience minor resistance at the 78.6% retracement before launching an assault on the all-time high at $4,384.
ETH/USD daily chart
A return of selling in the cryptocurrency market could push Ethereum price down to the February high at $2,042, but any further weakness would unravel the bullish narrative. ETH could target the May 23 low at $1,728 and then the 200-day SMA at $1,638.
XRP price bias is to the downside for the foreseeable future
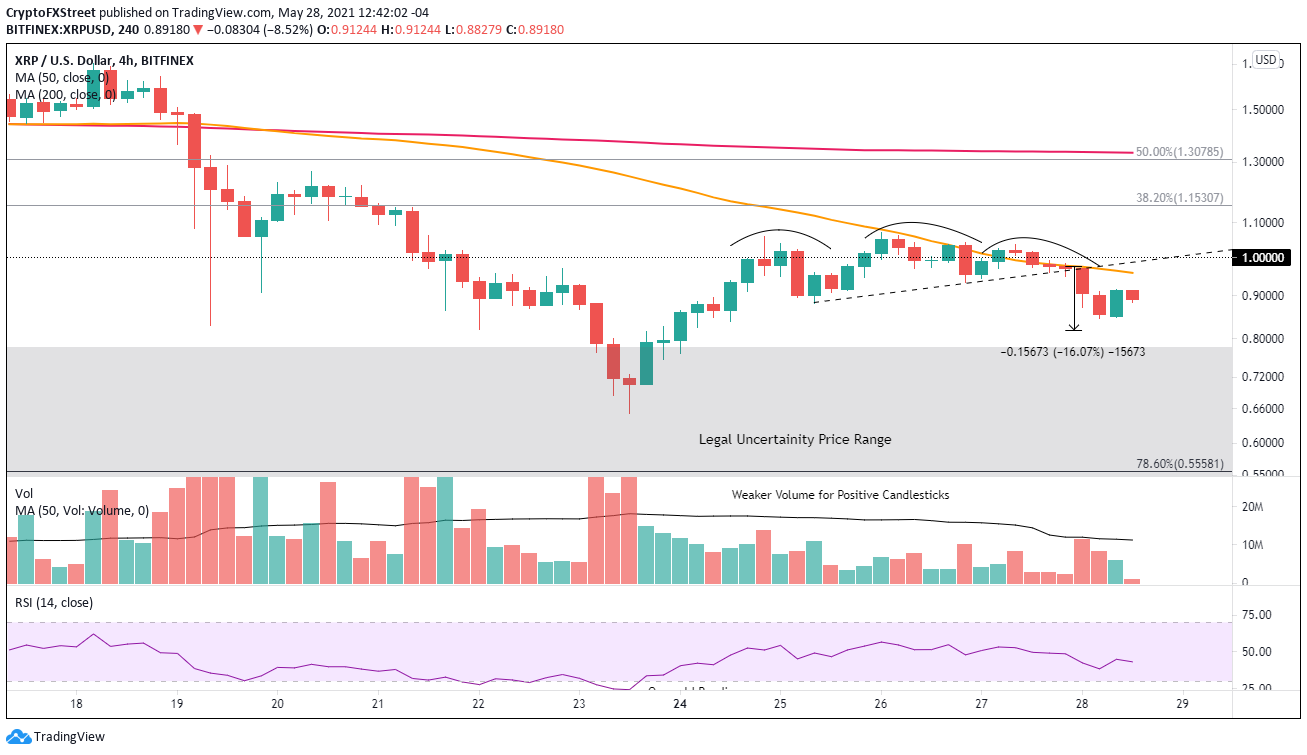
Over the last four trading days, XRP price had wrestled with the psychologically important $1.00 and the 50 four-hour SMA. The price action during this time had been passive with waning volume and no demonstrable interest in upside progress, suggesting a mild pullback may be necessary to effectively reset Ripple for a meaningful charge beyond the tactically essential price points.
During the churn, XRP price defined a head-and-shoulders pattern on the four-hour chart that triggered a few hours ago when it dropped below the neckline at $0.975. The measured move target was $0.818 based on the position of the neckline when the pattern was triggered. It would push XRP price near the upper level of the ‘legal uncertainty price range.’
A possibility exists that XRP price will test the upper level of the price range at $0.780 and may even decline to the February 21 high at $0.757, representing a 20% drop from the neckline. Any further weakness raises the odds that Ripple will break under the May 23 low at $0.652, leaving the cross-border remittances token vulnerable to a 78.6% Fibonacci retracement test from the December rally 29 low at $0.555.
XRP/USD 4-hour chart
To reverse the short-term bearish narrative, XRP price needs to rally beyond the right shoulder at the psychologically important $1.00. It would free Ripple to test the 38.2% retracement of the April-May decline at $1.15. Further upside will be complicated by the intersection of the 50% retracement level at $1.30 with the 200 four-hour SMA at $1.33.
To be sure, as long as the SEC case continues, XRP price will be predominately influenced by the sentiment of the broader cryptocurrency market and the price action of the bellwether cryptocurrencies, Bitcoin and Ethereum.
Author

Sheldon McIntyre, CMT
Independent Analyst
Sheldon has 24 years of investment experience holding various positions in companies based in the United States and Chile. His core competencies include BRIC and G-10 equity markets, swing and position trading and technical analysis.



