XRP Price Prediction: Ripple bears eye $0.75
- XRP price fails to gain price traction, forming head-and-shoulders pattern on the four-hour chart.
- 50 four-hour simple moving average (SMA) cutting through the topping pattern creating technical pressures for Ripple.
- Psychologically significant $1.00 playing an active role again in directing XRP price.

XRP price has failed to be a champion during the bounce off the May 19 and May 23 lows, generating only a 50% gain from the low. Over the last four days, the price action has been more reflective of a topping process, putting Ripple at risk of a pullback in the coming days.
XRP price intentions remain unclear after bounce
XRP price closed on May 23 with a bullish hammer candlestick pattern that was effectively triggered on May 24 when Ripple traded above $0.816. The candlestick formed in the ‘legal uncertainty price range’ associated with the November 2020 high and the December 2020 low, a time in which the SEC case was announced.
Over the last four trading days, XRP price has wrestled with the psychologically important $1.00 and the 50 four-hour SMA. The price action during this time has been passive with waning volume and no demonstrable interest in upside progress, suggesting a mild pullback may be necessary to effectively reset Ripple for a meaningful charge beyond the tactically important price points.
XRP price is projected to define a head-and-shoulders topping pattern on the four-hour chart, generating the needed pullback to reset Ripple for the second leg of the bounce. The measured move target is $0.807 based on the current position of the neckline. It would push XRP price near the upper level of the ‘legal uncertainty price range.’
A possibility exists that XRP price will test the upper level of the price range at $0.780 and may even decline to the February 21 high at $0.757, representing a 20% drop from the neckline. Any further weakness raises the odds that Ripple will break under the May 23 low at $0.652, leaving the cross-border remittances token vulnerable to a test of the 78.6% Fibonacci retracement of the rally from the December 29 low at $0.555.
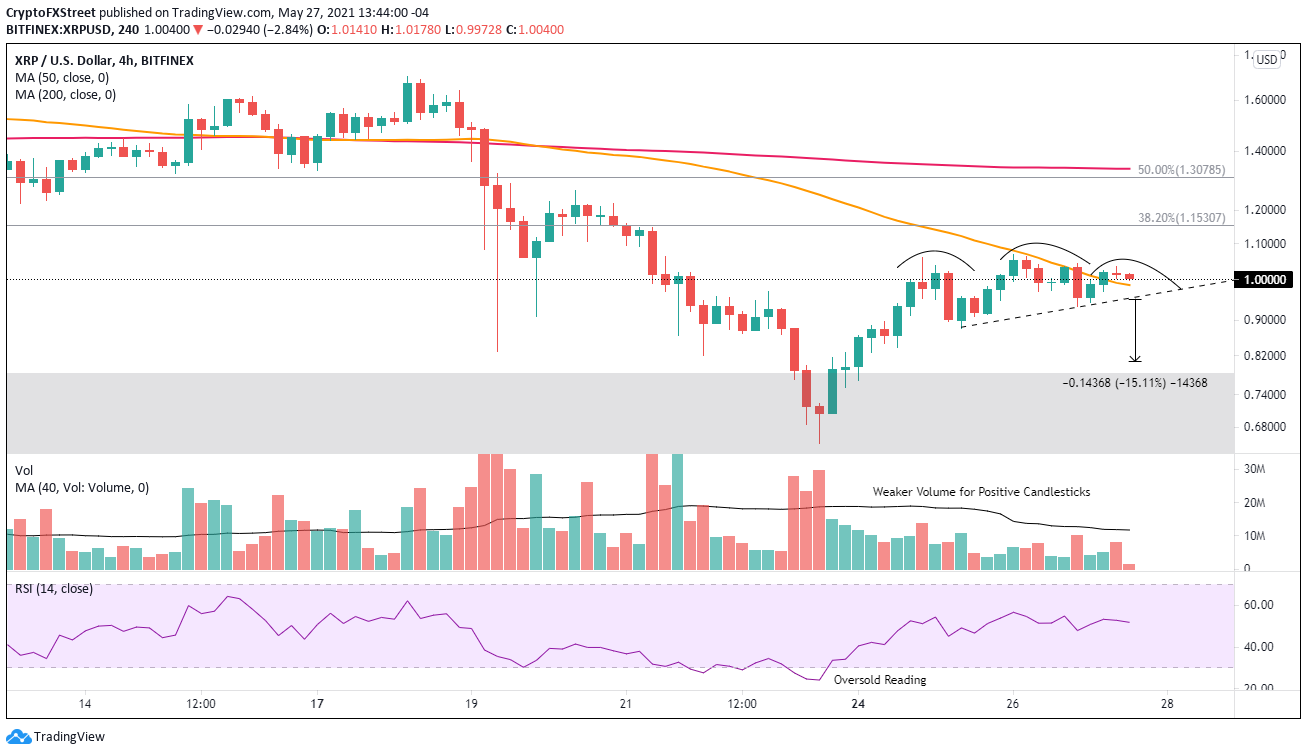
XRP/USD 4-hour chart
To reverse the short-term bearish narrative, XRP price needs to rally beyond the head of the head-and-shoulders pattern at $1.07. It would free Ripple to test the 38.2% retracement of the April-May decline at $1.15. Further upside will be complicated by the May 10-13 lows around $1.20-$1.23.
To be sure, as long as the SEC case continues, XRP price will be predominately influenced by the sentiment of the broader cryptocurrency market and the price action of the bellwether cryptocurrencies, Bitcoin and Ethereum.
Author

Sheldon McIntyre, CMT
Independent Analyst
Sheldon has 24 years of investment experience holding various positions in companies based in the United States and Chile. His core competencies include BRIC and G-10 equity markets, swing and position trading and technical analysis.


