Top 3 Price Prediction Bitcoin, Ethereum, Ripple: BTC reverses, causing altcoin gains to crumble
- Bitcoin price has sliced below a crucial inclined trend line, signaling a downswing.
- Ethereum price is likely to retest the $3,000 psychological level if investors continue to book profits.
- Ripple price inches closer to retesting the $1.09 support level, hoping to bounce off it.

Bitcoin price has slid below a vital support level and is likely to head toward the next significant barrier. While this downswing could be a minor sell-off, altcoins, including Ether and Ripple, seem to be showing no strength as they slice through critical demand areas.
Bitcoin price faces a decisive moment
Bitcoin price has respected an inclining trend line formed since July 20. However, the recent upswing failed to manifest, leading to a downswing that shattered that supportive trend line. As a result, BTC will likely head toward the $46,000 support level, the next crucial barrier.
The demand zone ranging from $43,150 to $45,791 will play a pivotal role in absorbing the selling pressure.
The buyers have a chance to kick-start an uptrend from here. If it occurs, the rally aims at the $51,000 level, a breach of which is necessary to continue the ascent to $57,000.
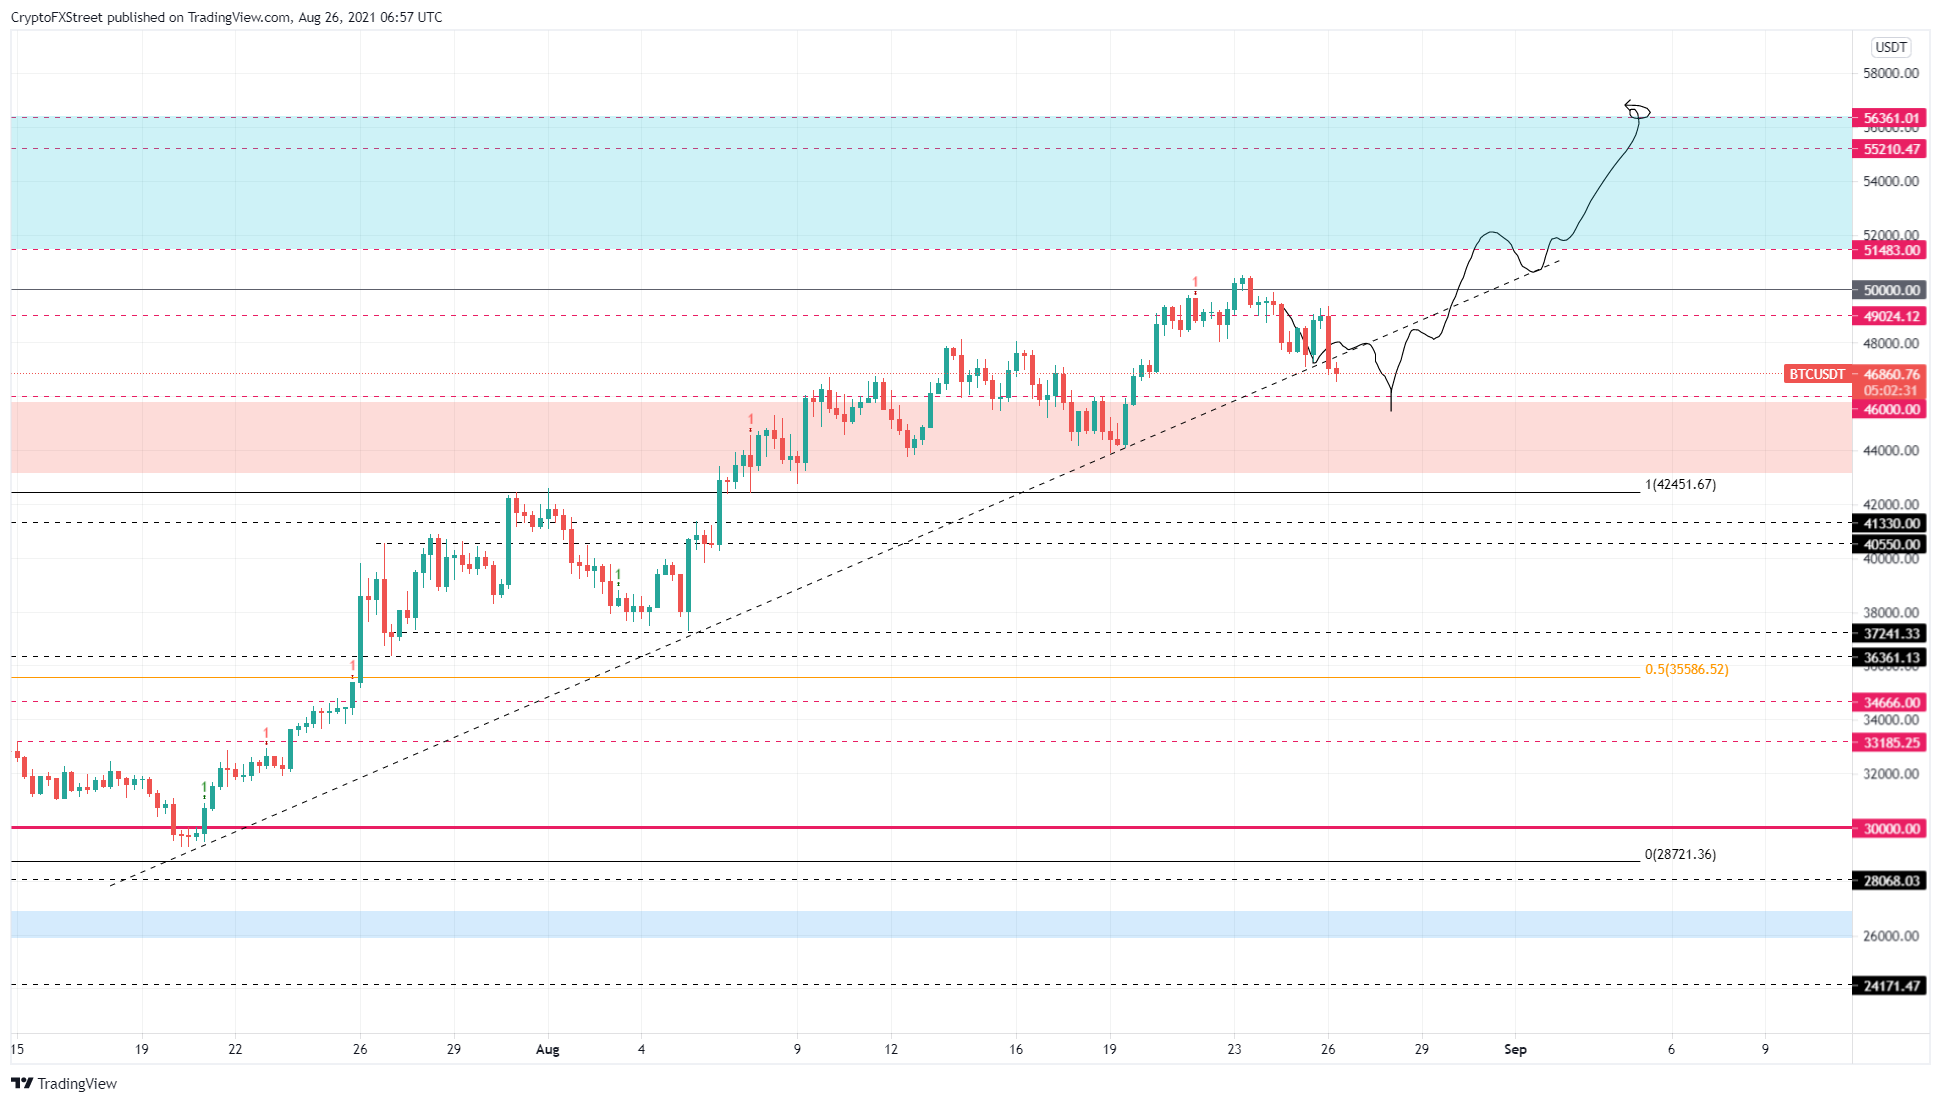
BTC/USDT 12-hour chart
On the other hand, if Bitcoin price fails to hold above $46,000, it is likely to dip into the demand zone, ranging from $43,150 to $45,791.
A decisive close below $43,150 will invalidate the bullish outlook and potentially trigger a downswing to $42,000.
Ethereum price teeters around $3,000 psychological level
Ethereum price has faced extreme selling pressure around $3,375, which has prevented it from rallying twice over the past two weeks. The recent attempt set up a swing high at $3,377, but instead it underwent a 9% retracement to where it currently stands. While ETH is following BTC, it might experience a steeper correction than its forebear.
Ether set up an equal high below $3,375, but the Relative Strength Index (RSI) formed a lower high, known as an exaggerated bearish divergence, further confirming a downswing.
The first support that the bears will encounter is the $3,000 psychological support, but a breach of this barrier might push ETH down to $2,893 and, in a highly bearish case, $2,742.
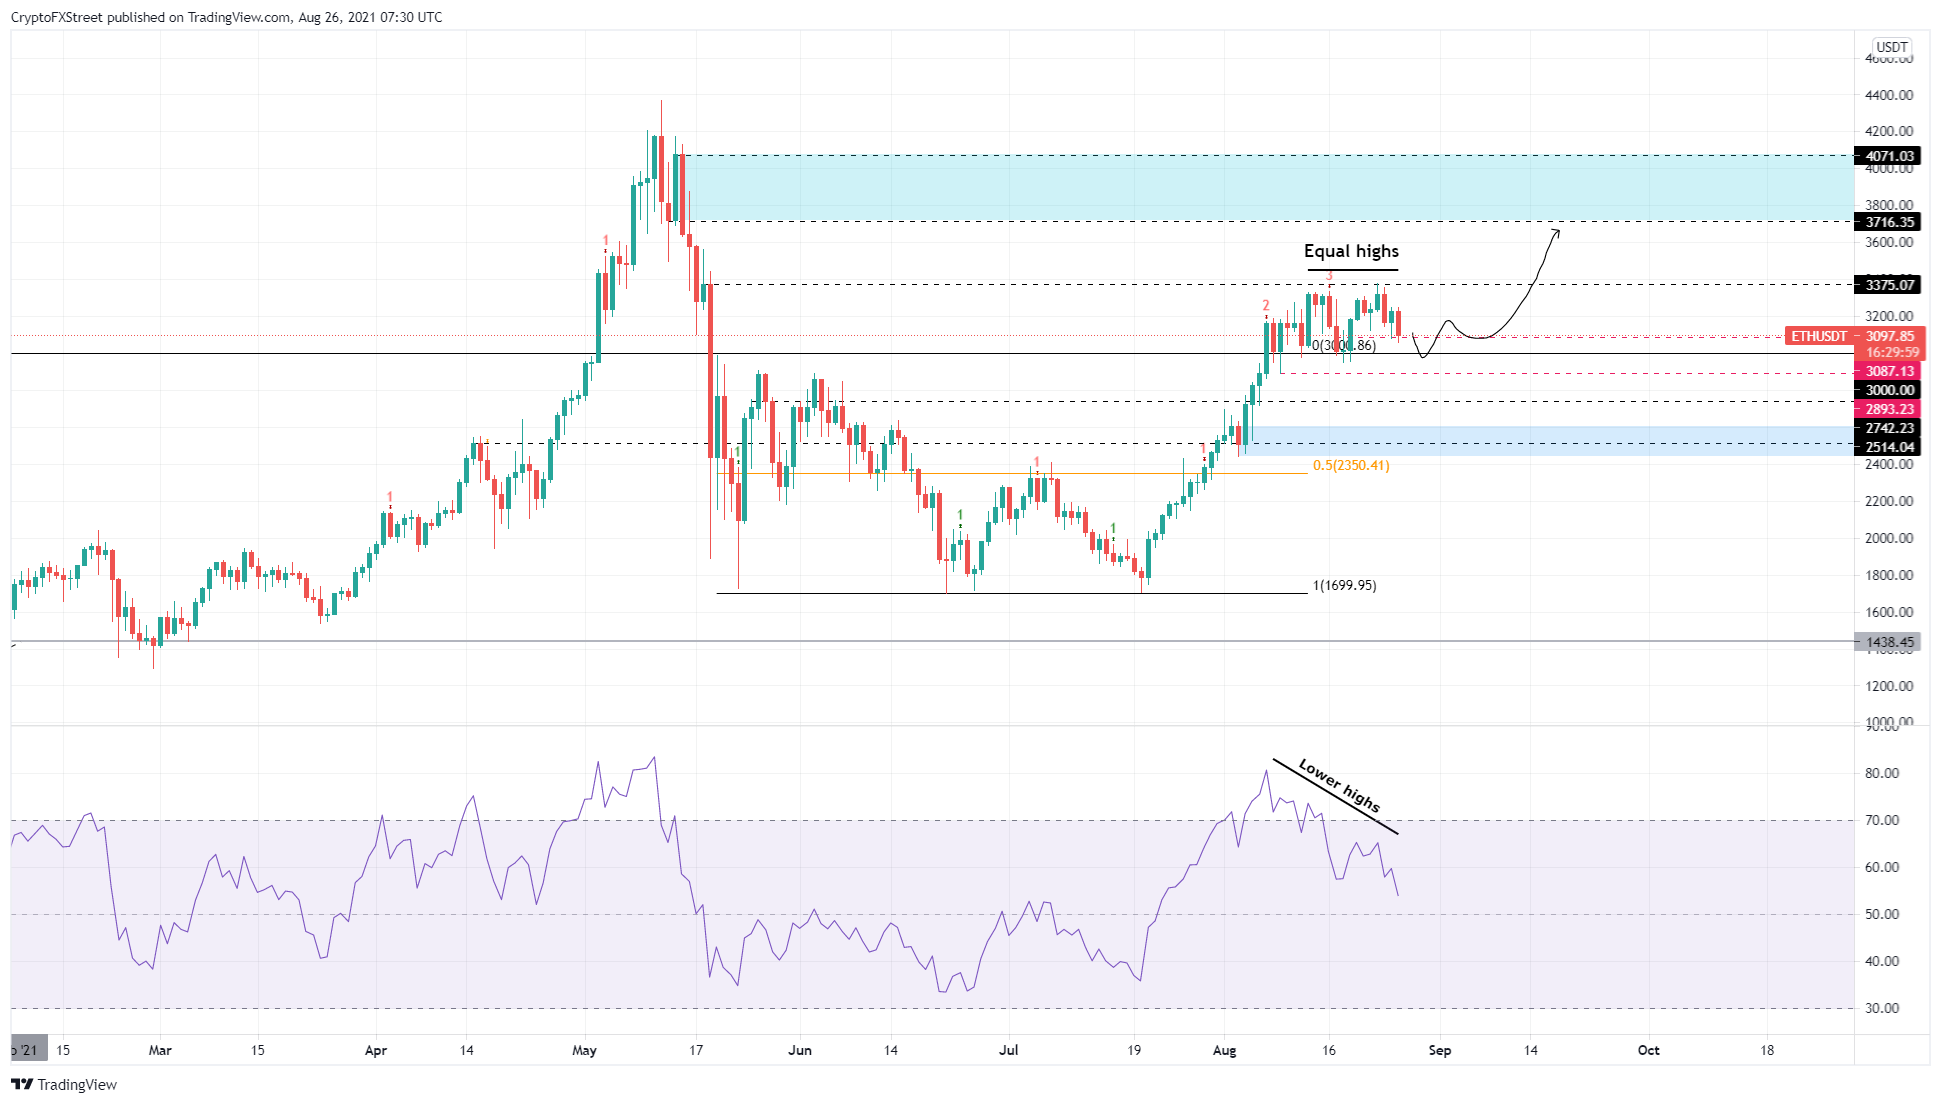
ETH/USDT 1-day chart
On the other hand, if Ethereum price forms a triple bottom and sees a bullish reaction off the $3,000 barrier, it could restart the upswing. Only a higher high above the $3,375 resistance level will invalidate the bearish outlook and confirm a new uptrend’s start.
Ripple price at make or break point
Ripple price is traversing a bullish pennant pattern. The remittance token rallied roughly 77% since August 9 and set up a local high at $1.35 on August 15. This ascent was followed by a consolidation that resulted in higher lows and lower highs. While the initial leg-up is considered a flagpole, the coiling up that preceded it is known as a pennant.
This setup forecasts a 43% upswing to $1.81, obtained by adding the flagpole’s height to the breakout point.
Assuming XRP price produces a decisive close above the pennant’s upper trend line at $1.27, it will confirm the start of a new uptrend.
Further supporting the uptrend is the bullish divergence formed between the price’s lower lows and the RSI’s higher lows.
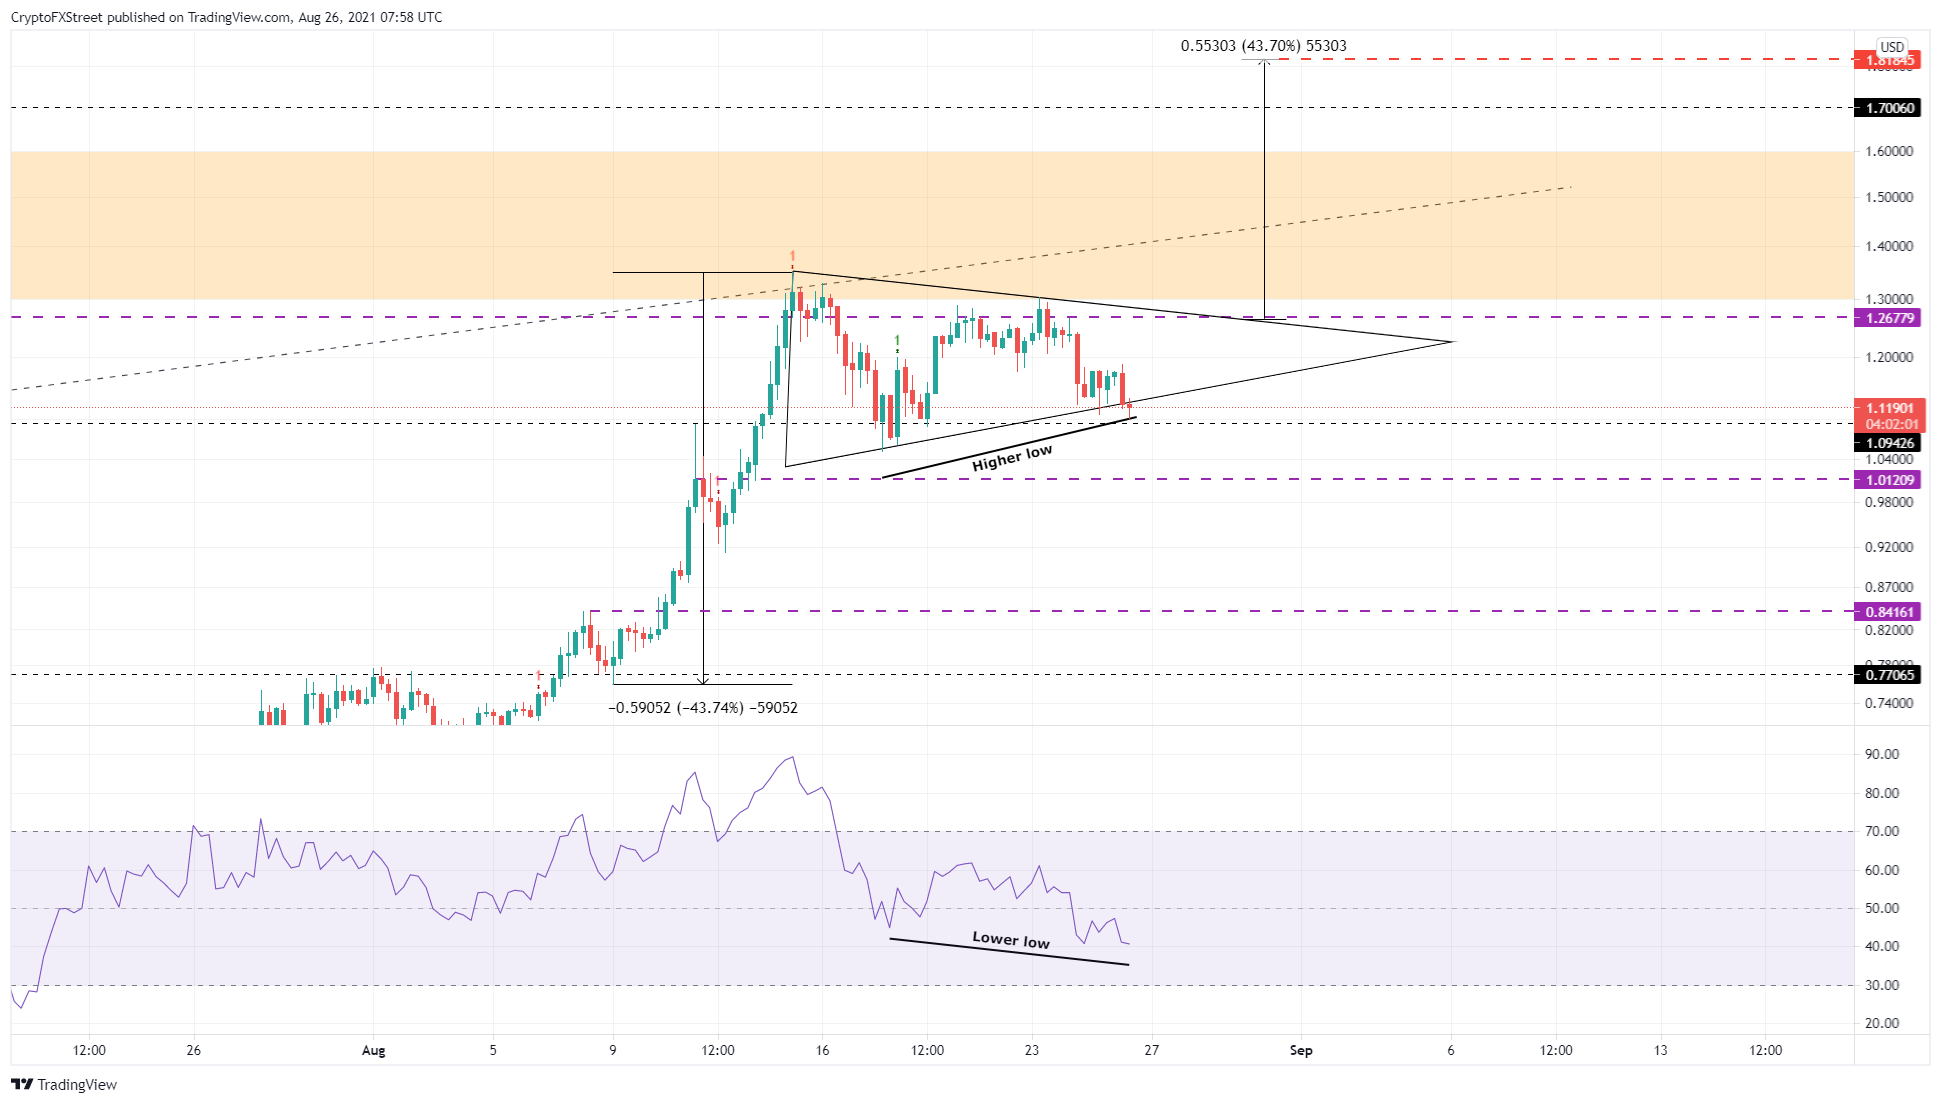
XRP/USDT 6-hour chart
Regardless of the bullish pattern that XRP price is forming, a breakdown of the pennant’s lower trend line will spell disaster for the coin. A convincing close below the August 18 swing low at $1.05 will invalidate the bullish thesis and could also trigger a crash to $1.01 and the August 8 swing high at $0.84.
Author

Akash Girimath
FXStreet
Akash Girimath is a Mechanical Engineer interested in the chaos of the financial markets. Trying to make sense of this convoluted yet fascinating space, he switched his engineering job to become a crypto reporter and analyst.


