Three reasons why XRP price could double in a few days
- XRP price is trading inside an ascending parallel channel, hinting at a bullish move shortly.
- Ripple is forming a bullish pennant on a lower time frame that could trigger a 47% advance.
- A steady increase in daily active addresses suggests rising interest among users, supporting an optimistic outlook.

XRP price has been on an impressive upswing over the past month. While most altcoins are retracing, Ripple has managed to stay afloat without intense drawdowns.
Going forward, XRP price should likely experience a similar uptrend.
XRP bullish outlook from a long-term perspective
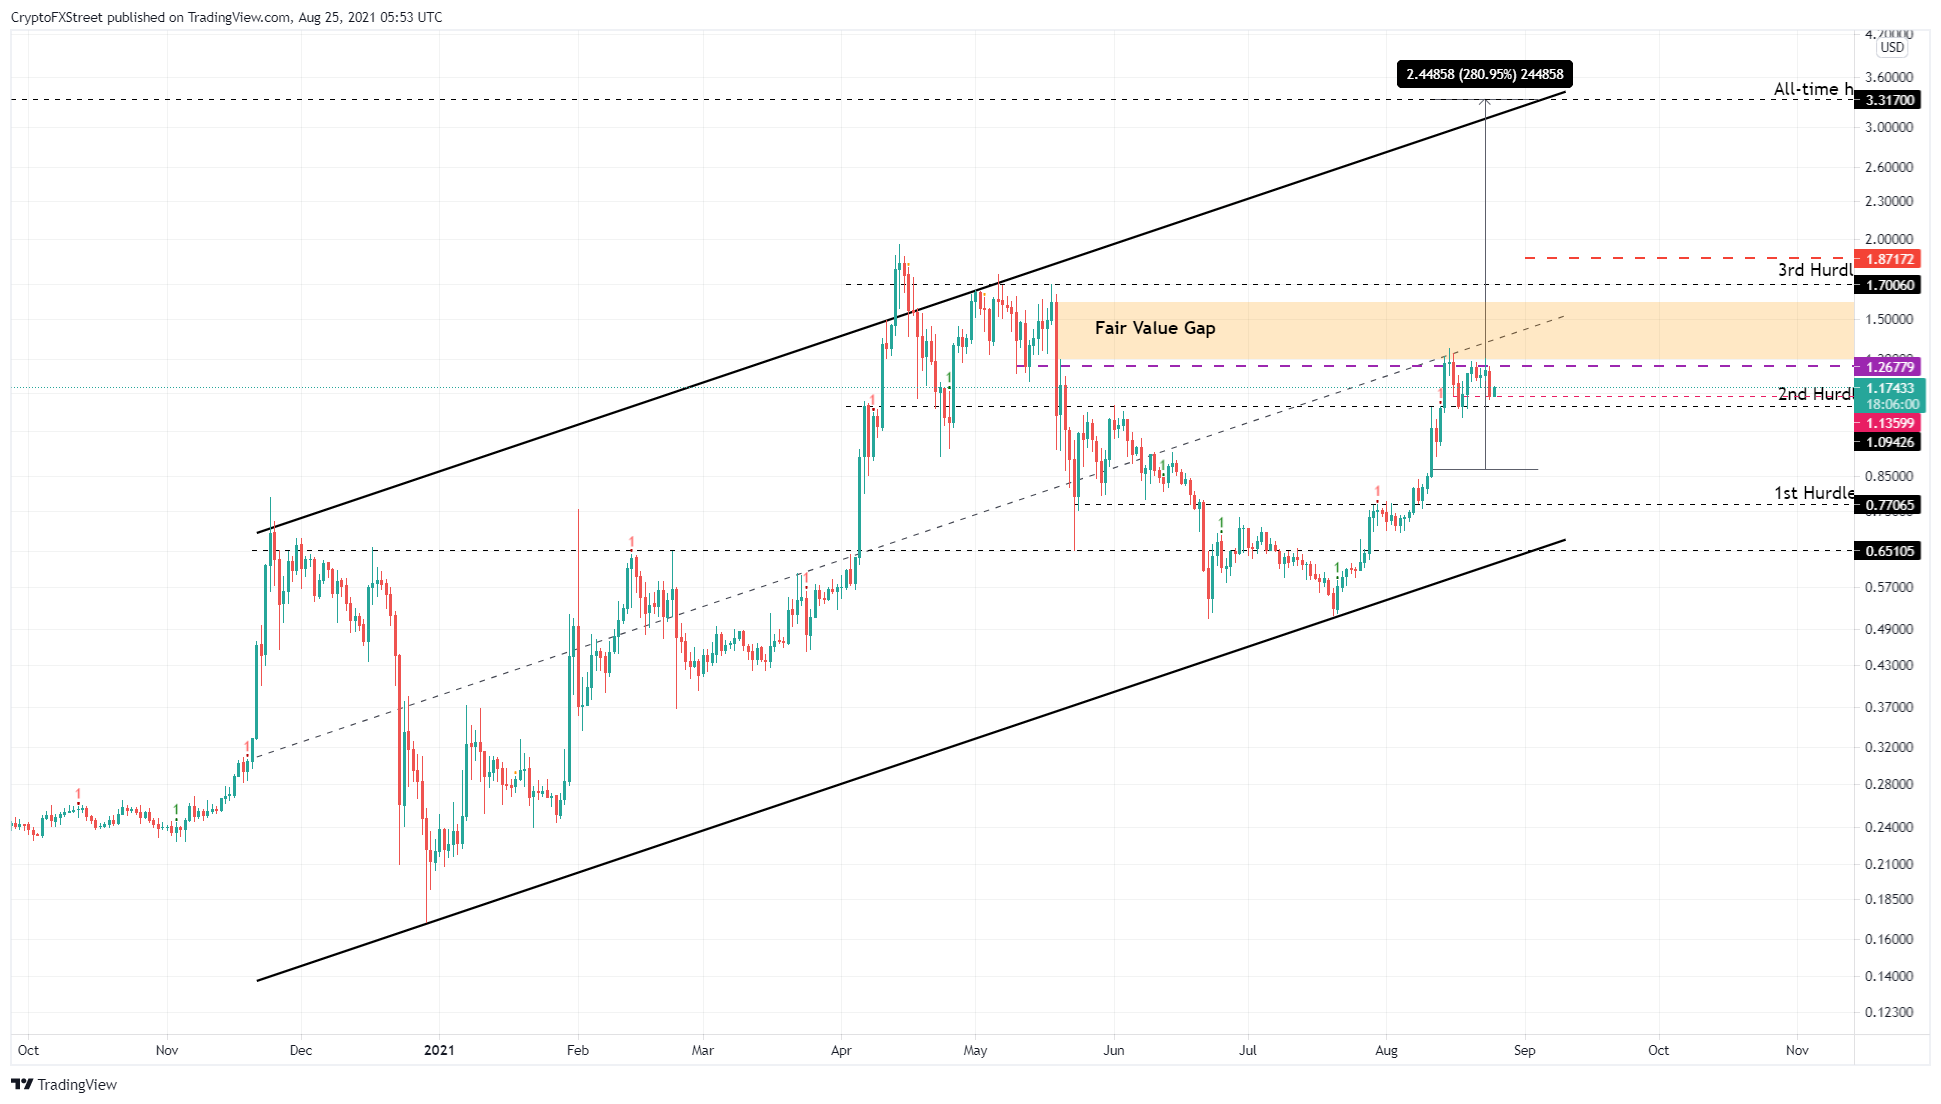
XRP price has set up higher highs and higher lows since November 2020. Drawing trend lines that join these swing points reveals the formation of an ascending parallel channel. Although a breakout from this technical formation is bearish, the massive nature of the pattern shows Ripple is on a journey from one end of the channel’s trend line to another.
Since pointing out the setup, XRP price has managed to rally 62% but has retraced 12% to where it currently trades at $1.17.
The last two times the remittance token bounced off the lower trend line of the channel, it eventually touched the upper ceiling. Assuming XRP price is doing something similar puts roughly 180% gains on the table to its all-time high at $3.31.
This run-up will not be a piece of cake. It will encounter $1.27, a brutal resistance barrier that has prevented its previous rally, and the $1.70 ceiling before having a chance to head to the 2018 all-time high at $3.31.
To add to the bullish outlook, Ripple shows the formation of a fair value gap (FVG) ranging from $1.30 to $1.60 (highlighted in orange). During the May 19 crash, the XRP price quickly moved away from $1.60 to $1.30 without any impulse moves, leaving a gap and creating inefficiency.
While some volatile altcoins have already filled their respective FVGs, the XRP price has not yet. A decisive daily candlestick close above $1.30 will open a least-resistance path to $1.60.
Therefore, market participants can expect an increased bullish activity as Ripple breaches the $1.27 supply barrier.
XRP/USDT 1-day chart
Short-term charts show imminent gains on the horizon
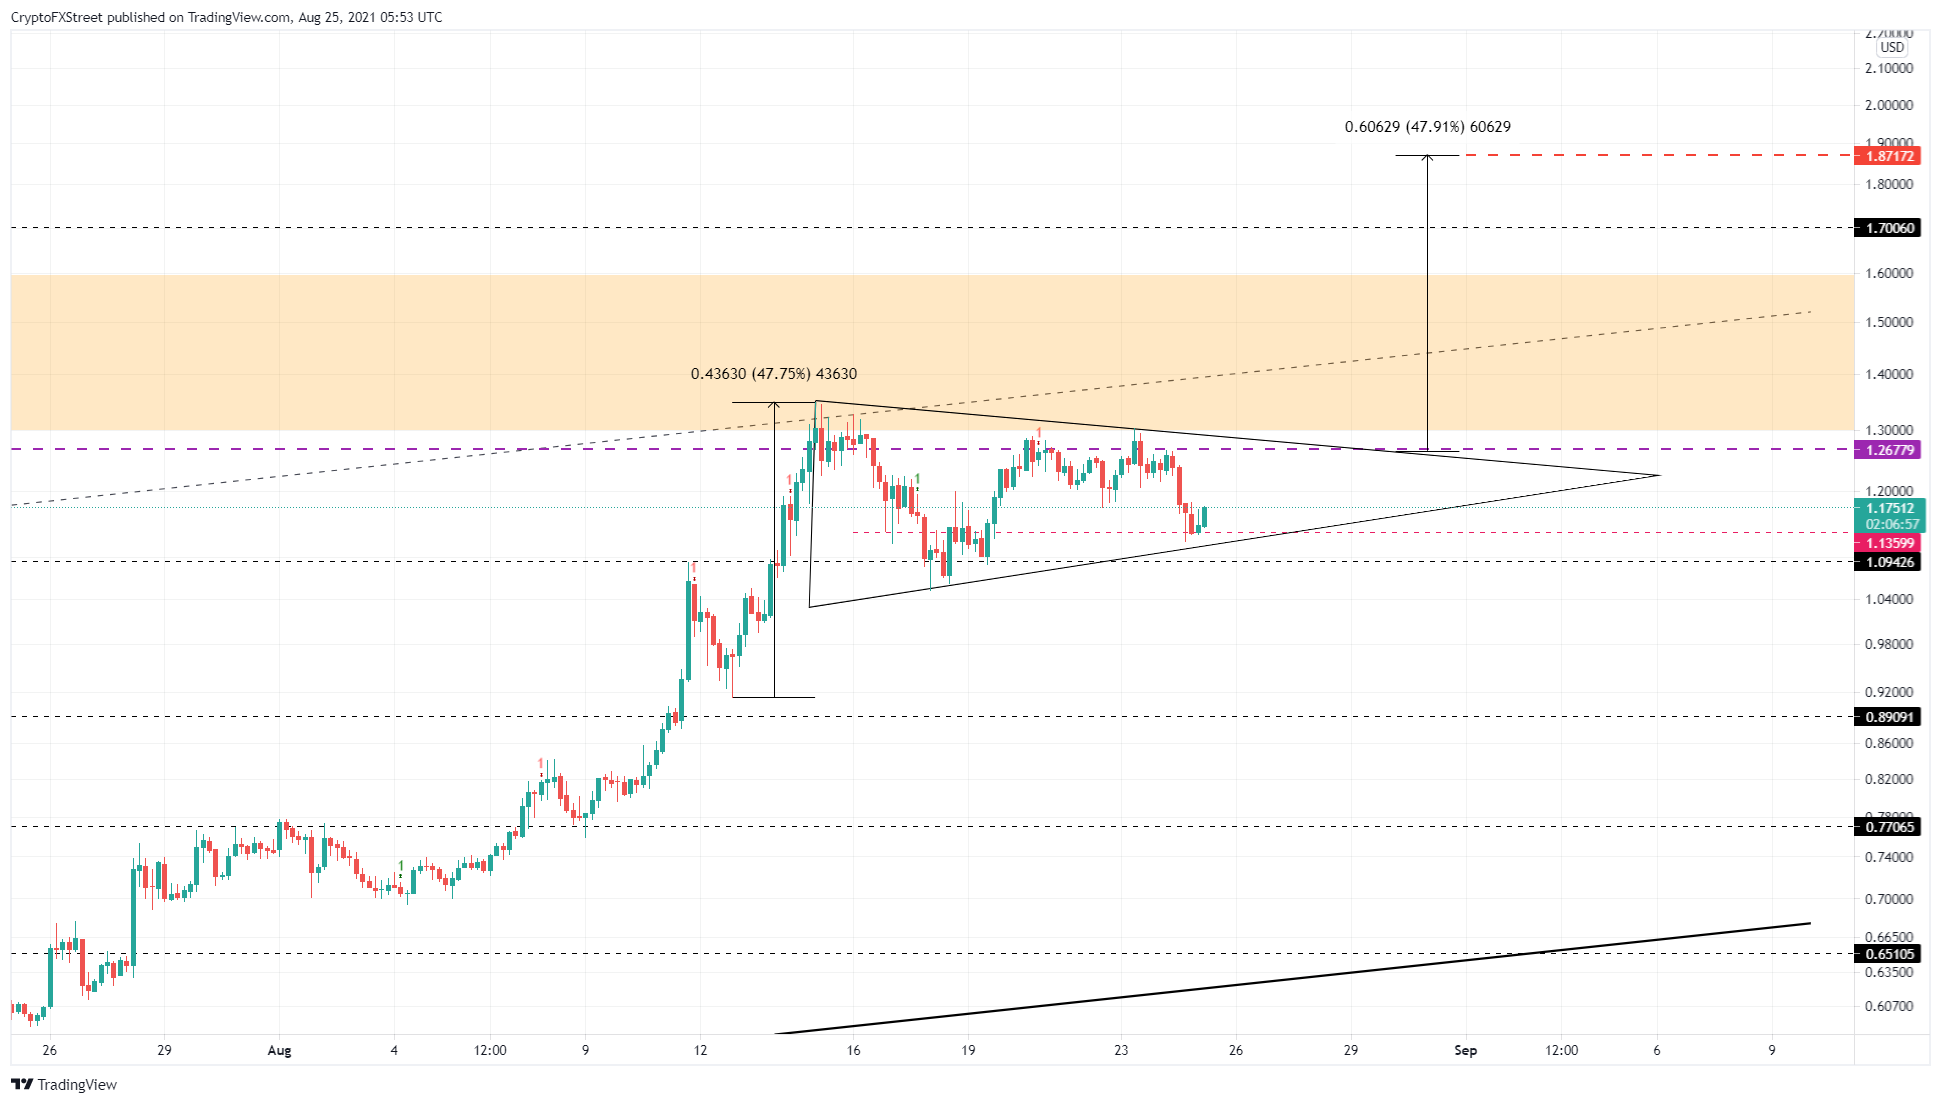
Although the longer time frame charts paint a bullish picture, a second look at the 4-hour chart shows XRP price is forming a bullish pennant.
The 47% surge that took place between August 12 and August 15 resulted in a flagpole, while the ongoing consolidation period that followed since then created the pennant.
This continuation pattern signals a 47% upswing to $1.87, determined by measuring the flagpole’s height and adding it to the breakout at $1.27.
Therefore, a 4-hour candlestick close above $1.27 is imperative for the bullish outlook to play out.
A successful breakout puts XRP price just above the third hurdle at $1.87, opening the path to the 2018 all-time high at $3.31, as discussed above.
XRP/USDT 4-hour chart
Increasing investor interest
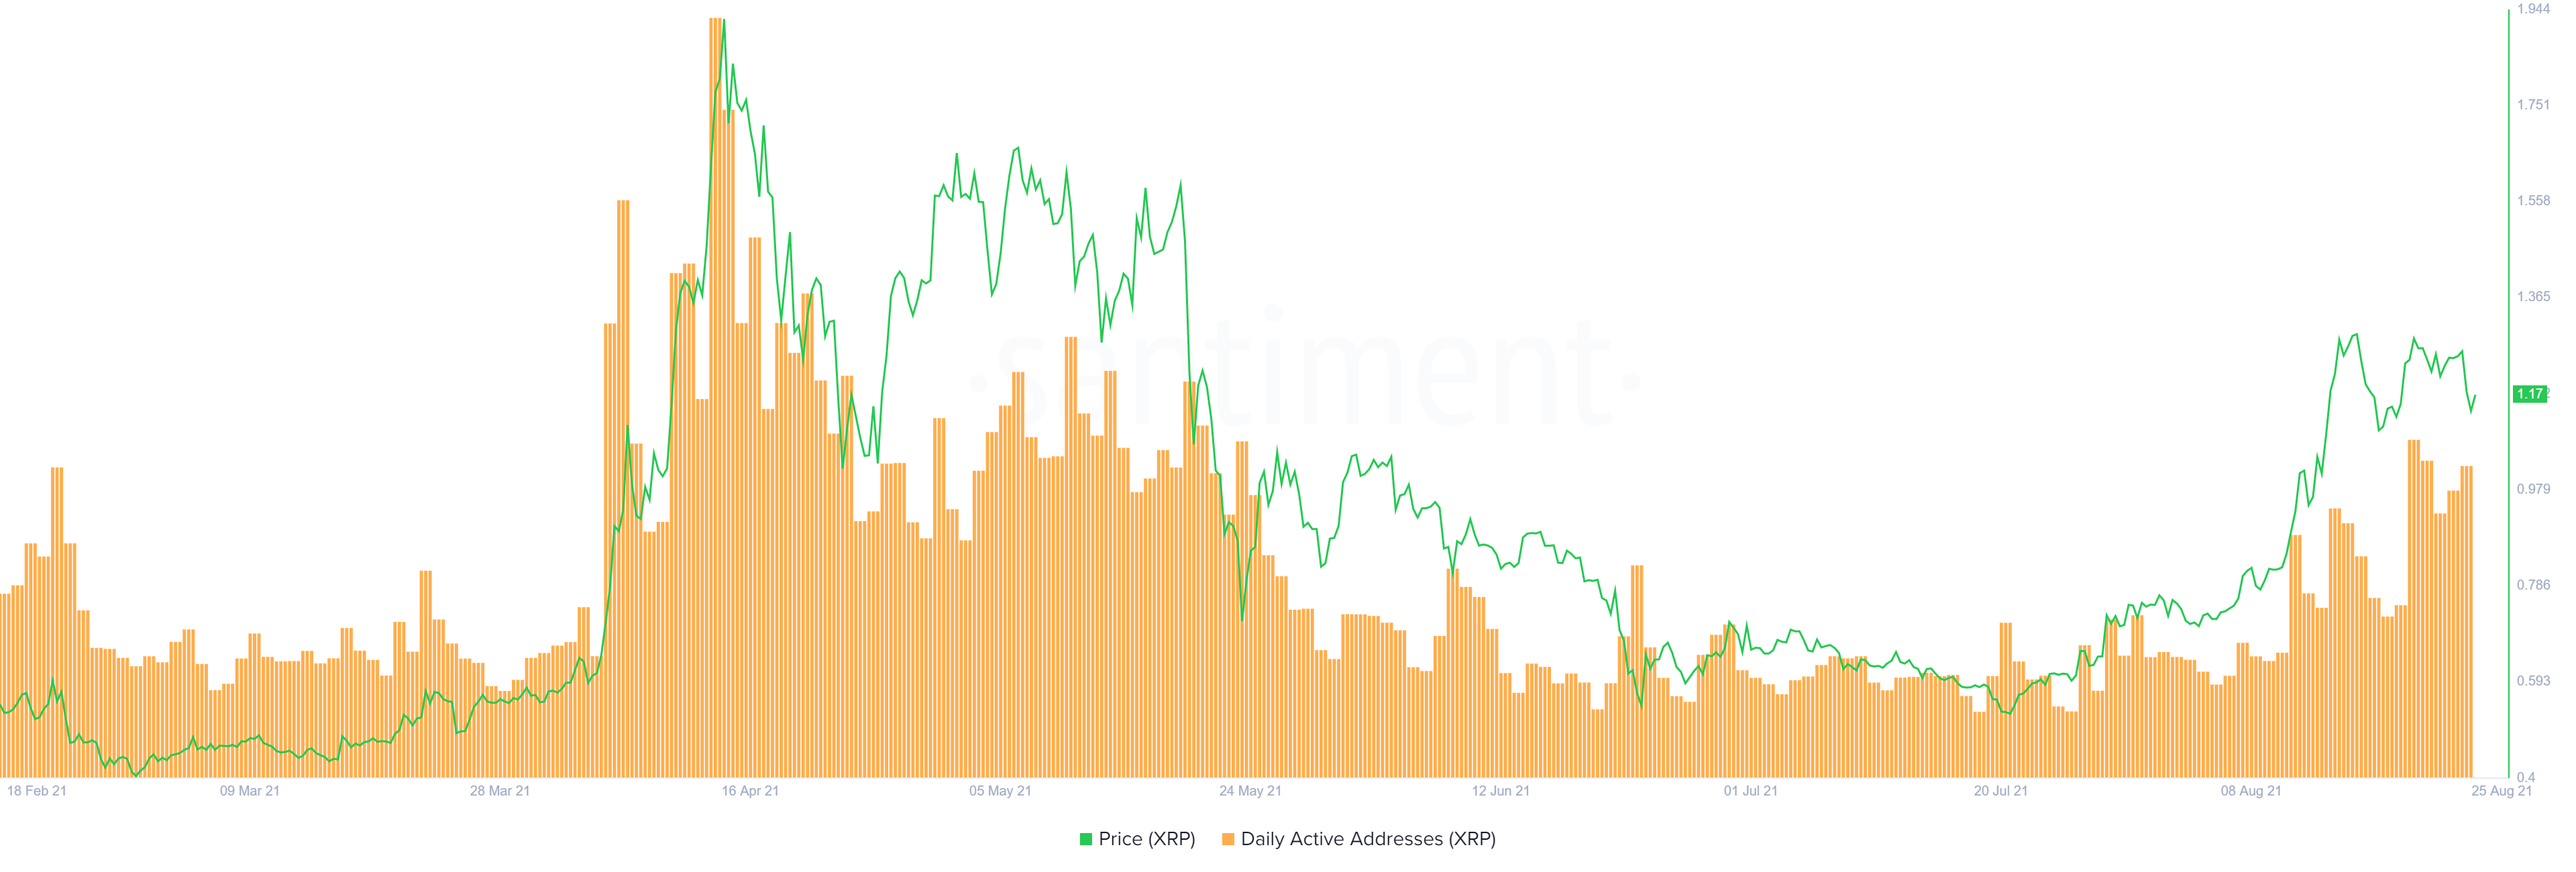
While the upswing in XRP price is already palpable, on-chain data reveals that the number of users interacting with the XRP Ledger (XRPL) is rising at a steady rate.
The number of daily active addresses on the XRPL grew from 9,233 on July 25 to 23,537 on August 24. This 176% spike in users indicates a rising interest and a proxy to investor interest and a potential inflow of capital.
XRP daily active addresses chart
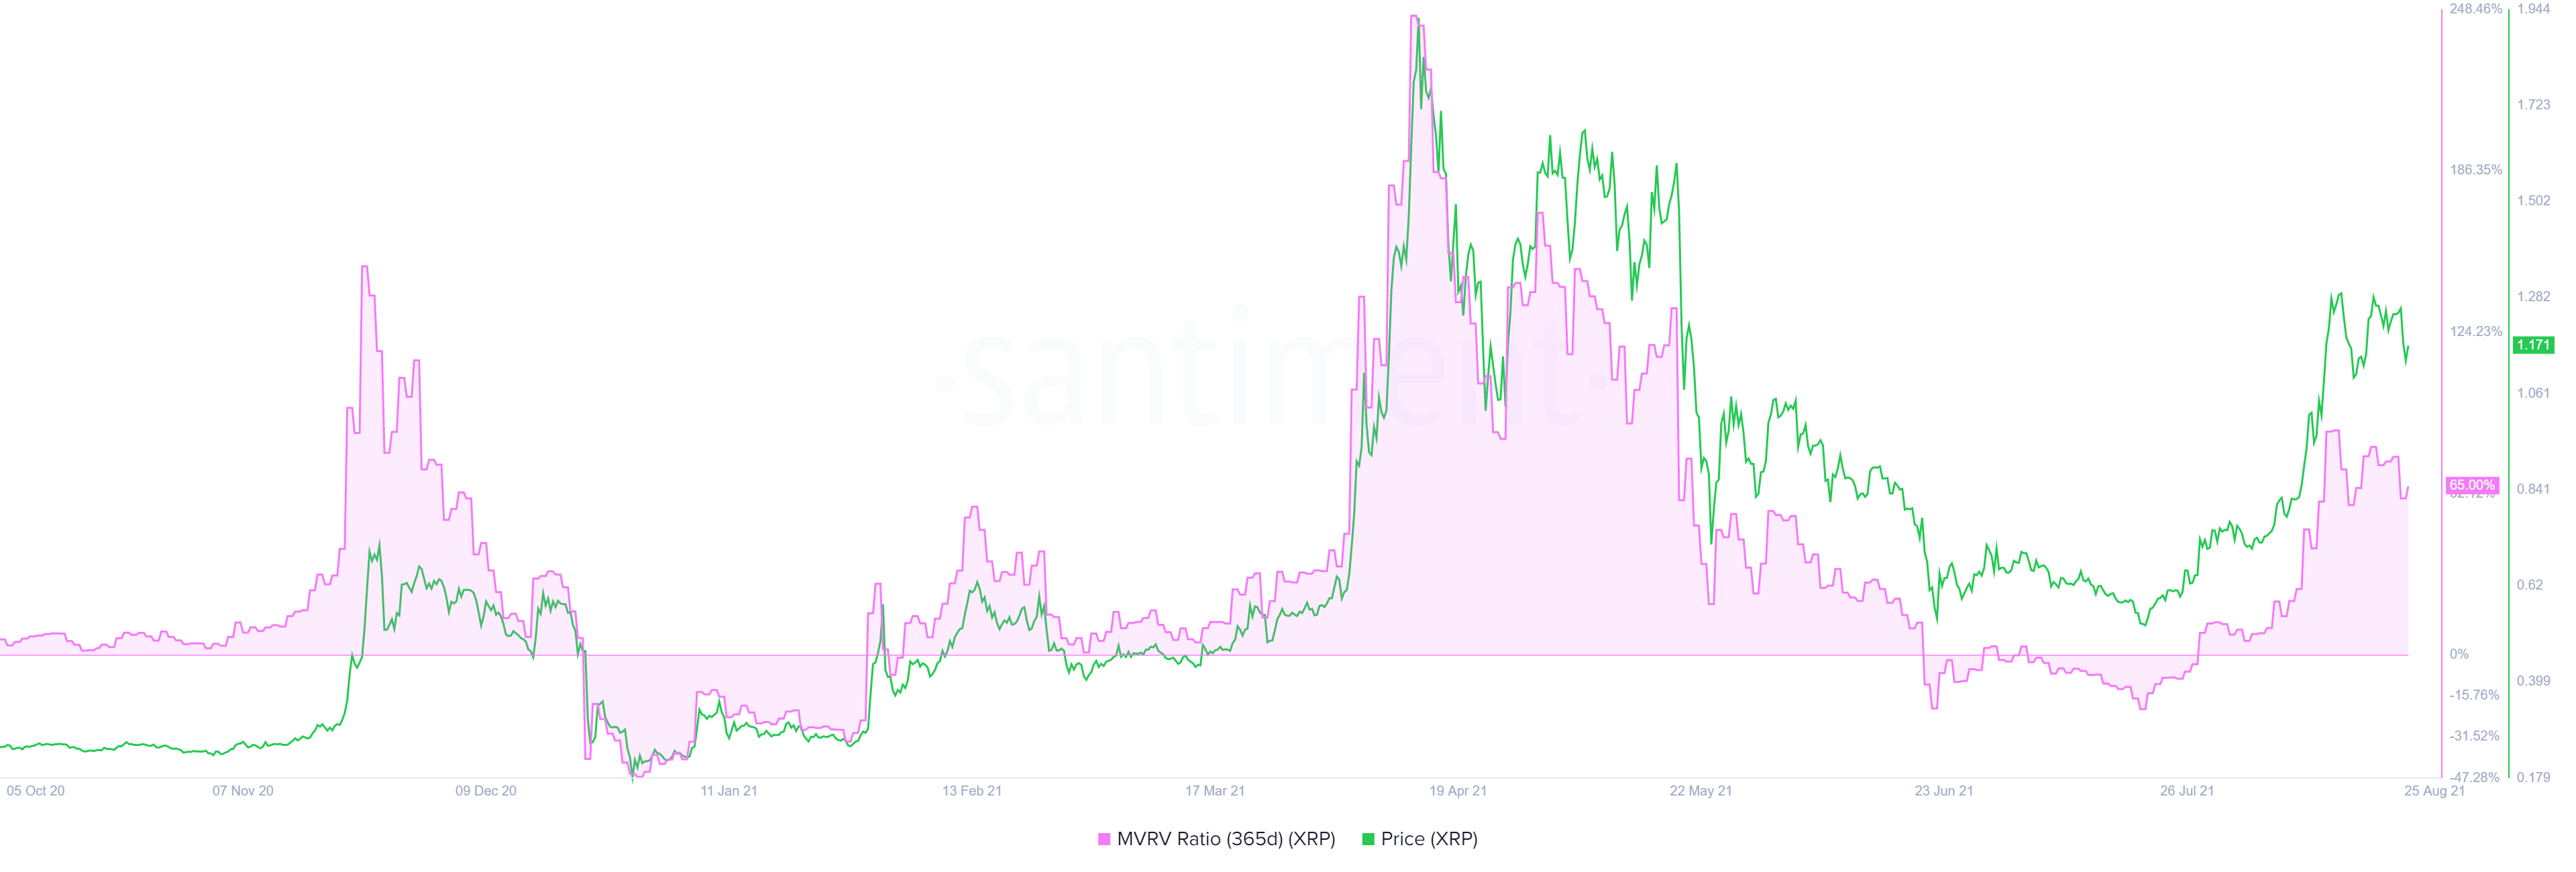
The 365-day Market Value to Realized Value (MVRV) model, currently hovering around 64%, goes against the bullish outlook discussed above.
This fundamental index tracks the average profit/loss of investors that purchased XRP over the past year. A high MVRV value indicates that a large portion of holders are in profit, which increases the chances of a crash if these participants begin to realize their gains.
Therefore, traders or holders need to pay close attention to exchange inflows or a spike in large transactions that generally serve as a precursor to a flash crash.
XRP MVRV 365-day chart
Therefore, a sudden spike in selling pressure could quickly push the XRP price to retest the $1.09 support level. A breakdown of this barrier would reveal a bearish development and open up the possibility of tagging the subsequent support floor at $0.90.
If the momentum builds up, Ripple might produce a swing low below $0.91, invalidating the bullish thesis. In a highly bearish case, XRP price could also retest $0.77, which would constitute a 30% crash from the $1.09 support level.
Author

Akash Girimath
FXStreet
Akash Girimath is a Mechanical Engineer interested in the chaos of the financial markets. Trying to make sense of this convoluted yet fascinating space, he switched his engineering job to become a crypto reporter and analyst.



