Top 3 Price Prediction Bitcoin, Ethereum, Ripple: BTC lateralizes with lots of orders above and below
- Bitcoin price must stay above the 0.382 Fibonacci retracement level to continue the trend.
- Ethereum price could drop to 200-day SMMA at $2,957 before ETH bulls flock the scene.
- XRP will only be attractive to buy once Ripple price enters golden zone between $0.5453 and $0.6235.
Bitcoin (BTC) price dropped during the New York session on Wednesday, whiplashing over $100 million in positions. Ethereum (ETH) and Ripple (XRP) price dropped in the aftermath, with global cryptocurrency market capitalization dropping by $50 billion, a 2% drop to $2.41 trillion. Over the past couple of weeks, most sell-offs have occurred during the New York session.
Also Read: Bitcoin price could be primed for correction as bearish activity grows near $66K area
The market is calm and hasn't yet chosen its direction
Despite the drop in Bitcoin price, the market remains calm, seen with the single-digit drops of at most 5%. For now, anything is possible, and big news could be the catalyst to push the price up. From a technical standpoint, the setup remains promising. The market is only lateralizing because of the many orders above and below the current BTC price.
#Bitcoin Both gaps in nearby proximity still open technically, but filled for the most part.
— Daan Crypto Trades (@DaanCrypto) April 24, 2024
Only like a ~$100 gap left on both sides which is often considered as closed. https://t.co/EaZb7FduO1 pic.twitter.com/YOuIgKhHa9
Bitcoin price must close above 38.2% for short-term upside
Bitcoin price is sitting atop support due to the 38.2% Fibonacci retracement level of $64,628. If this buyer congestion level is lost, BTC would fall in the hands of the bears, shown by the gray spikes on the volume profile to show a lot of bearish activity taking place below the aforementioned Fibo level.
An extended fall, where Bitcoin price breaks and closes below $62,374 on the 4-hour chart would confirm the continuation of the downtrend to the $60,000 psychological level.
With the nose-diving Relative Strength Index (RSI), buying pressure is dropping fast, worsened by the Moving Average Convergence Divergence (MACD), which has just crossed below its signal line to show the beginning of a short-term bearish cycle.
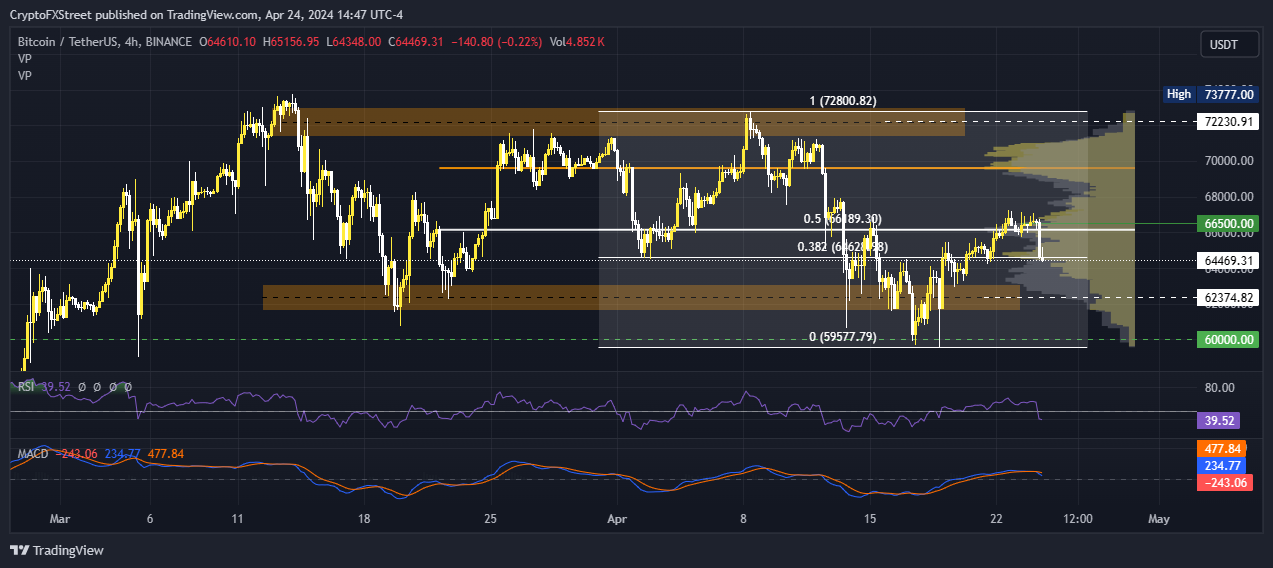
BTC/USDT 4-hour chart
On the other hand, if the bulls can hold above the 38.2% Fibonacci retracement level, and close above $64,628 on the four-hour time frame, it would encourage more buy orders. The ensuing demand pressure could see Bitcoin price move to retake the 50% Fibonacci placeholder at $66,189.
Beyond this level, BTC bulls would have a home run to the $70,000 price range, which would set the tone for a reclamation of the $73,777 all-time high and potentially even a new peak.
Ethereum price likely to retest the 200-day SMMA
Ethereum price is consolidating within a falling wedge pattern. While this bullish reversal pattern continues to hold, ETH is suffering the aftermath of weakness in the market after sentiment from the drop in BTC price spilled over to altcoins.
If the RSI closes below the 50 mean level on the eight-hour time frame, accentuated by a bearish crossover of the MACD below the signal line, it could instigate a sell-off. The initial target for Ethereum price in such a directional bias would be around the 200-day Smooth Moving Average (SMMA) at $2,957.
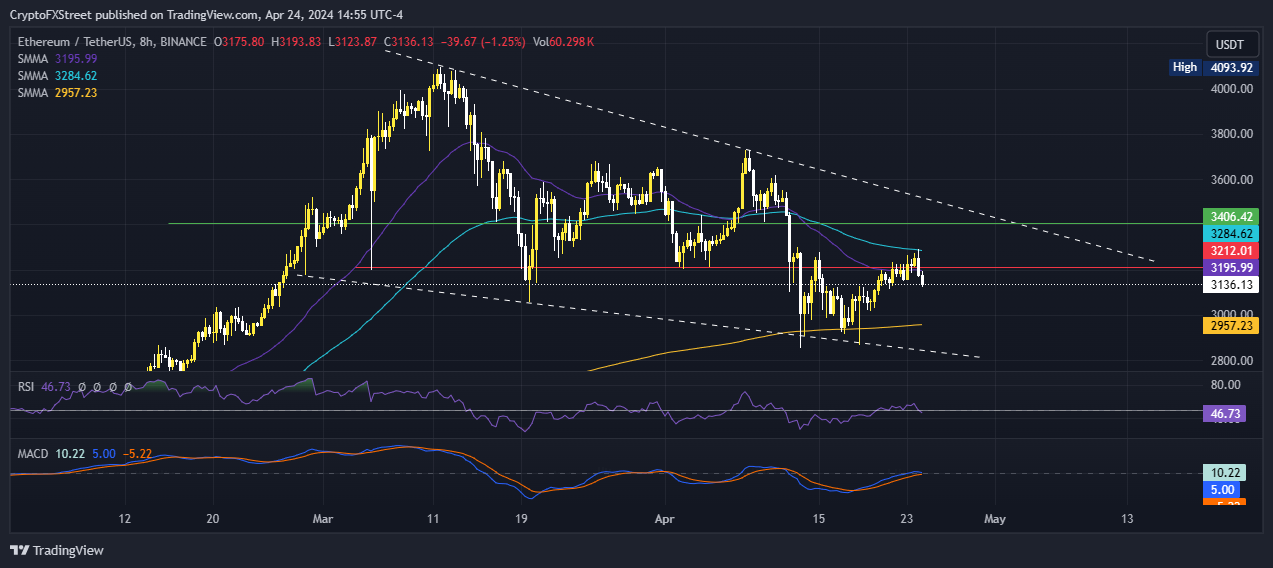
ETH/USDT 8-hour chart
On the other hand, if the bulls recover the market, the Ethereum price could overcome the roadblock due to the 50-day SMMA at $3,284. This could set the pace for an extended climb above the $3,406 barricade.
A decisive candlestick close above $3,284 level, followed by consolidation above it would set the tone for a breakout to activate the falling wedge pattern. The target objective for this pattern is a 25% move above the breakout point, achieved by determining the average height of the wedge.
Also Read: Ethereum ETF issuers not giving up fight, expert says as Grayscale files S3 prospectus
Ripple price must foray into the Golden Zone to entice XRP bulls
Ripple price remains below the 61.8% Fibonacci retracement level of $0.5453, with mounting overhead pressure from the 21, 50 and 200-day SMMA at $0.5658, $0.5771 and $0.5561 levels, respectively. For XRP to become attractive for buying, the price must overcome these blockades into the Golden Zone.
The Fibonacci Golden Zone is a key area in price charts that signals potential stabilization or reversal points after significant market movements, with the 61.8% and 50% levels forming the crucial Golden Zone.
A candlestick close above the 50% Fibonacci placeholder of $0.5844 would entice more bulls, sending XRP price past the 38.23% Fibonacci retracement level of $0.6235.
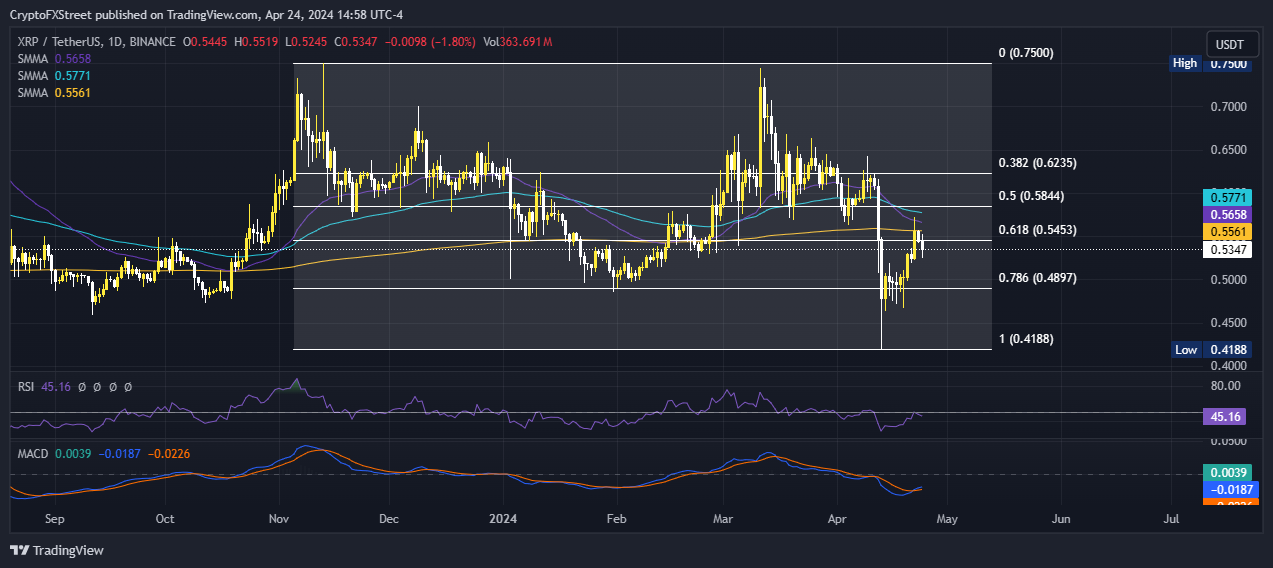
XRP/USDT 1-day chart
If the 61.8% Fibonacci retracement level holds as resistance, however, the XRP price could drop. A candlestick close below the 78.6% Fibonacci retracement level would invalidate the bullish thesis, whereas the price recording a lower low below $0.4188 would signify a trend reversal to the downside.
Notice the RSI below the 50 level. If the trajectory extends, it could soon record a lower low, worsened by the MACD that remains in negative territory.
Also Read: XRP Price Outlook: A breakout or significant price movement may be imminent for Ripple’s token
Bitcoin, altcoins, stablecoins FAQs
Bitcoin is the largest cryptocurrency by market capitalization, a virtual currency designed to serve as money. This form of payment cannot be controlled by any one person, group, or entity, which eliminates the need for third-party participation during financial transactions.
Altcoins are any cryptocurrency apart from Bitcoin, but some also regard Ethereum as a non-altcoin because it is from these two cryptocurrencies that forking happens. If this is true, then Litecoin is the first altcoin, forked from the Bitcoin protocol and, therefore, an “improved” version of it.
Stablecoins are cryptocurrencies designed to have a stable price, with their value backed by a reserve of the asset it represents. To achieve this, the value of any one stablecoin is pegged to a commodity or financial instrument, such as the US Dollar (USD), with its supply regulated by an algorithm or demand. The main goal of stablecoins is to provide an on/off-ramp for investors willing to trade and invest in cryptocurrencies. Stablecoins also allow investors to store value since cryptocurrencies, in general, are subject to volatility.
Bitcoin dominance is the ratio of Bitcoin's market capitalization to the total market capitalization of all cryptocurrencies combined. It provides a clear picture of Bitcoin’s interest among investors. A high BTC dominance typically happens before and during a bull run, in which investors resort to investing in relatively stable and high market capitalization cryptocurrency like Bitcoin. A drop in BTC dominance usually means that investors are moving their capital and/or profits to altcoins in a quest for higher returns, which usually triggers an explosion of altcoin rallies.
Author

Lockridge Okoth
FXStreet
Lockridge is a believer in the transformative power of crypto and the blockchain industry.


