XRP Price Outlook: A breakout or significant price movement may be imminent for Ripple’s token
- Ripple price monthly Bollinger bands show tightest squeeze ever amid shrinking volatility.
- Last time XRP price showed this much contraction, it soared around 850% to an ATH of $1.9669 during 2020 halving year.
- With volatility often cycling between a low and a high state, it may just be a matter of time.

Ripple (XRP) price has been range-bound for a while, with token holders patiently holding as the ecosystem contended against the US Securities and Exchange Commission (SEC). As per a recent report, the payments token’s price has been stuck below $0.50, failing to breach key resistance levels.
Ripple price monthly Bollinger bands show tightest squeeze ever
While the Ripple price has had XRP holders in a state of disarray for the longest time, a significant move may be in the works as the Bollinger Bands show the tightest contraction ever. The last time the bands were this squeezed was in 2020, the previous Bitcoin halving year. XRP price is holding above the centerline (20-period SMA) of the Bollinger indicator.
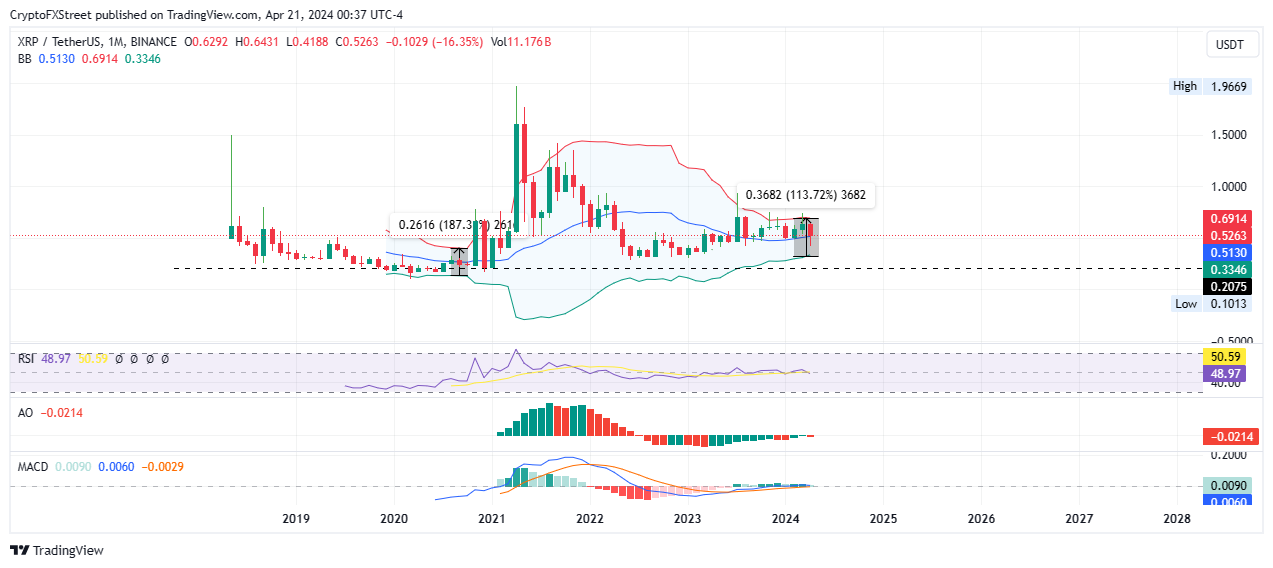
XRP/USDT 1 –month chart
The Bollinger Bands indicator measures the volatility of an asset’s price, with the squeeze or contraction being the core concept of this tool. The squeeze indicates a period of low volatility. Key tenets of the indicator are:
- Asset price movements outside the confines of the band are usually not sustainable.
- Price action above the upper band indicates overbought markets, suggesting a correction.
- Price action below the lower band indicates oversold markets, also suggesting a pullback.
- Contraction or squeeze shows low price volatility, while expansion indicates high price volatility.
- At least 95% of every price action takes place between the upper and lower boundaries.
Considering volatility often cycles between a low and a high volatility state, it may just be a matter of time before a breakout in XRP price. The Relative Strength Index (RSI) and Awesome Oscillator (AO) are borderline neutral, while the Moving Average Convergence Divergence (MACD) accentuates the same.
However, despite the negligible momentum shown by the RSI, AO, and MACD indicators, it is imperative to note that volatility does not support a flattened move. It just does not work that way.
During periods of narrow Bollinger Bands, traders may adopt range-bound strategies, buying near the lower band and selling near the upper band as they anticipate that the price will fluctuate within the established range.
For trend-following traders, narrow Bollinger Bands may signal a potential slowdown in the current trend or a period of consolidation before the trend resumes. It is important for traders to exercise caution and wait for confirmation signals before entering trades during narrow Bollinger Band conditions.
This report does not lean in favor of XRP making triple or even double-digit gains like it did in May 2020, but only suggests that a large move is coming.
Author

Lockridge Okoth
FXStreet
Lockridge is a believer in the transformative power of crypto and the blockchain industry.


