Top 3 Price Prediction Bitcoin, Ethereum, Ripple: BTC hangs on last line of defense after dragging market down
- Bitcoin price continued its crash as it slid another 11% today, pushing below $40,000.
- Ethereum price promptly followed the flagship cryptocurrency as it dropped below $3,000.
- Ripple is also deep inside the immediate demand zone, extending from $1.340 to $1.477, after Wednesday’s downswing.

Bitcoin price dragged the entire market down with it as it slid below critical levels. A similar turn of events occurred with Ethereum price as it fell under a key psychological level. Ripple price continues to be stuck between a wide support area and a resistance level.
Bitcoin price and its recent collapse
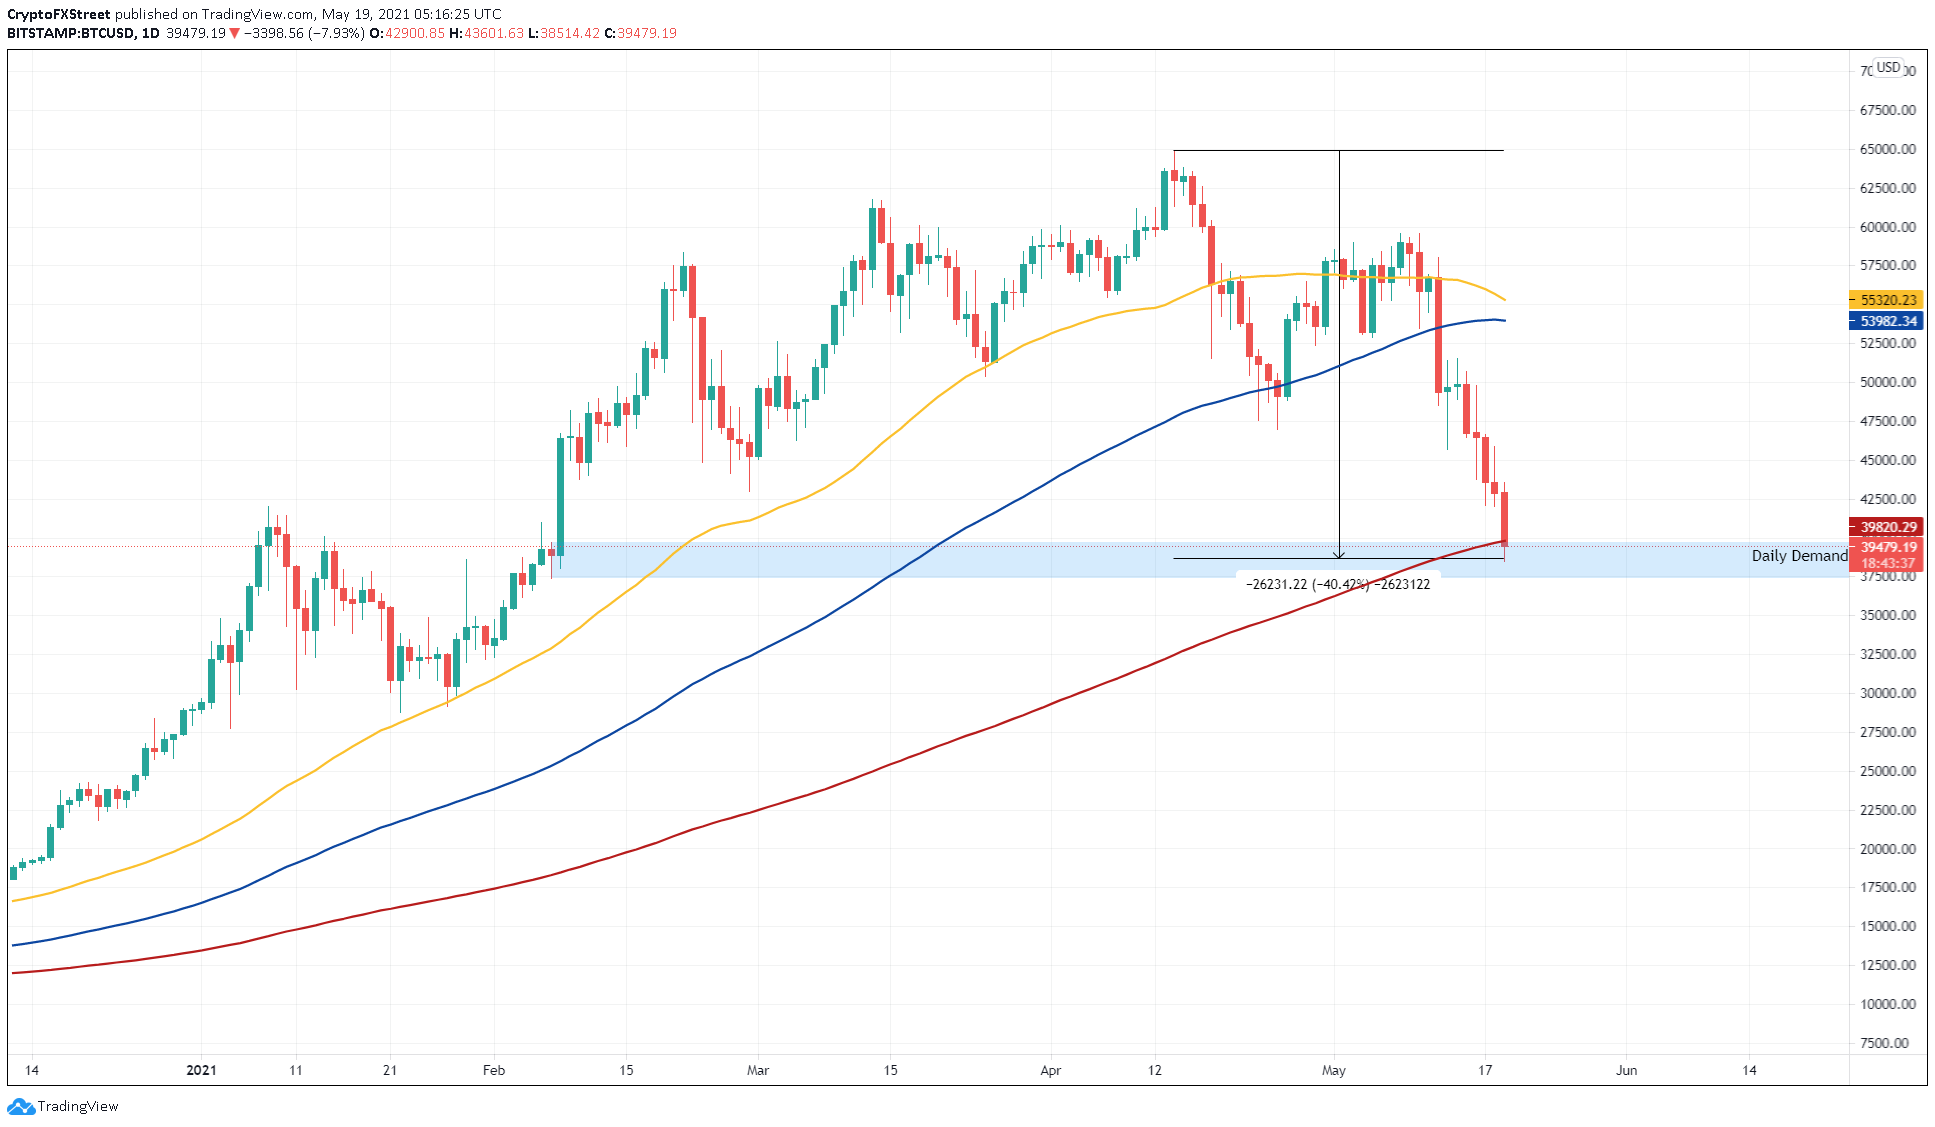
Bitcoin price is fragile as it trades around the 200-day Simple Moving Average (SMA) at $39,820. A decisive daily candlestick close below this would be highly bearish. Typically, a move above this level would indicate a macro shift in trend to bullish.
The opposite of this would also hold, which is why investors need to keep a close eye on the next daily close.
If the Bitcoin price closes above $39,820, BTC could surge 25% to $51,420, the recent swing high. Following a breach of the level mentioned above, the flagship cryptocurrency might tag the 50-day and 100-day SMAs at $55,320 and $53,982, respectively.
BTC/USDT 1-day chart
On the flip side, a convincing close below the 200-day SMA at $39,820, followed by a breakdown of $37,412 will invalidate the bullish outlook. Under these circumstances, Bitcoin price might slide 8% to $34,245, the next support barrier.
Ethereum price stumbles but looks bullish
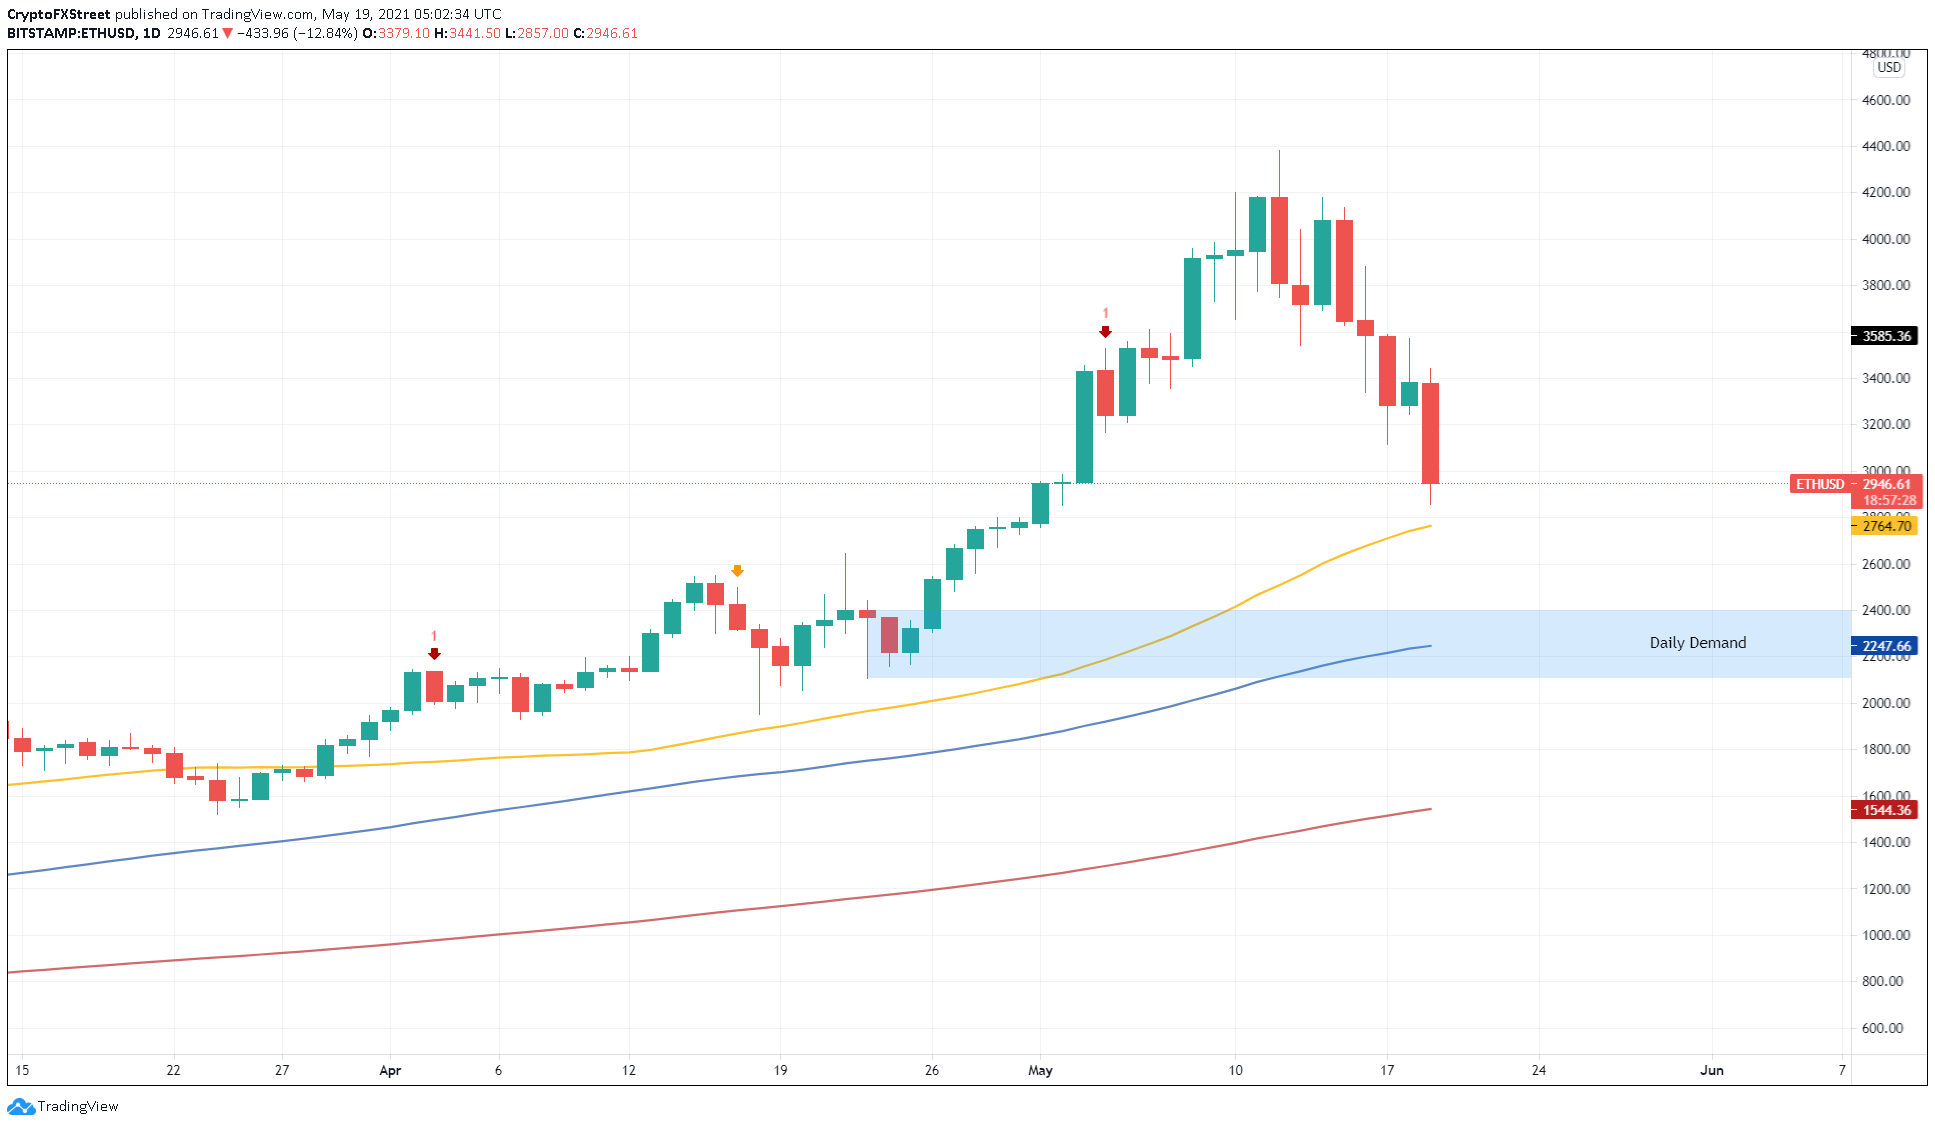
Ethereum price followed in the footsteps of the flagship cryptocurrency as it dropped roughly 17% on the day. However, ETH failed to tag the 50-day SMA at $2,765. Going forward, even if there is short-term selling pressure, Ethereum will most likely tackle it and make a comeback at the level mentioned above.
A surge in buying pressure here could catapult the smart contract token by 24% to the first resistance barrier at $3,430. Following this, if the bid orders continue to increase, investors could see the altcoin pioneer rise another 13% to test the swing high at $3,881 set up on May 16.
ETH/USD 1-day chart
With disregard to the support levels, if the market continues to freefall, it is inevitable that ETH price will shatter the 50-day SMA at $2,765 and test the subsequent level at $2,247. Interestingly, the 100-day SMA is present inside the demand zone that extends from $2,106 to $2,397.
While a sell-off into this level would be bearish without a doubt, a breakdown below $2,106 will completely invalidate the optimistic narrative detailed above. Such a move would invoke a 27% crash to the 200-day SMA at $1,544 in the process.
Ripple price ranges despite recent flash crash
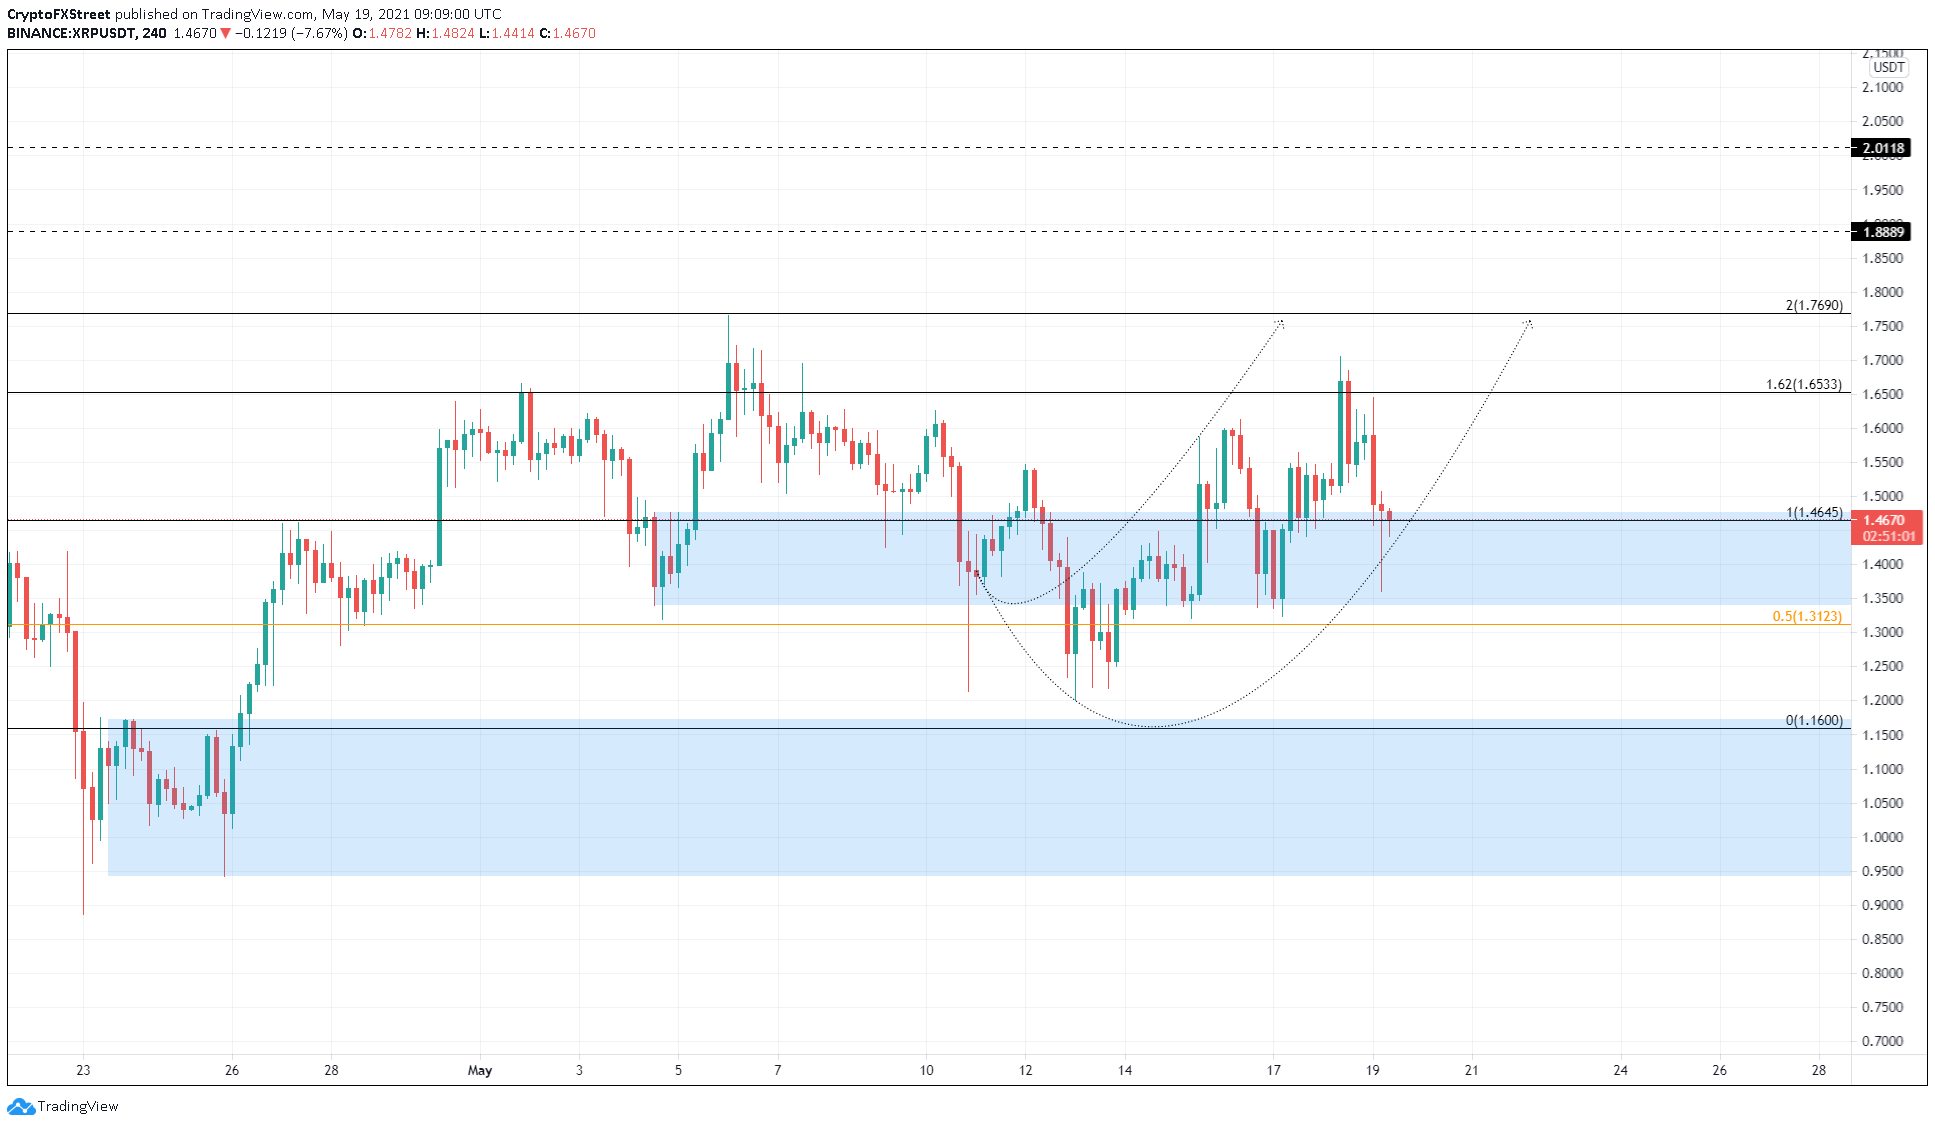
Ripple price shows resilience as it depreciated 17% during Wednesday’s volatile trading session. At the time of writing, XRP trades around $1.455, inside the demand zone that stretches from $1.340 to $1.477.
Although the flash crash took a toll on most altcoins, Ripple price remained within the range mentioned above. Now a surge in buying pressure will most likely push the remittance token up by 13% to a critical supply barrier at $1.653.
If buyers manage to produce a decisive 4-hour candlestick close above this level, XRP price will signal the start of a new uptrend. In that case, Ripple might rise 7% to its first area of interest at $1.769. Following a successful breach of this, XRP price will tag $2.
XRP/USDT 4-hour chart
A breakdown of the 50% Fibonacci retracement level at $1.312 will invalidate the bullish thesis. If the ask orders continue to pile up, XRP price could slide 8.5% to $1.20.
Author

Akash Girimath
FXStreet
Akash Girimath is a Mechanical Engineer interested in the chaos of the financial markets. Trying to make sense of this convoluted yet fascinating space, he switched his engineering job to become a crypto reporter and analyst.



