Breaking: Bitcoin price plummets below $40,000 while Ethereum price loses $3,000 as support
- Bitcoin price slips below $40,000 as it dropped roughly 40% from its all-time high at $64,895.
- This nosedive has pushed BTC below the 200-day SMA at $39,818, which is a bearish sign from a macro perspective.
- Ethereum price followed the flagship crypto as it slid below $3,000 after a 35% downswing from its record high at $4,380.

Bitcoin price has seen a massive selling pressure today that has caused to slice significant support levels. Ethereum price has also stepped under a crucial psychological level indicating a shift in trend.
Bitcoin price bull run gains in jeopardy
Bitcoin price has crashed roughly 11% on a daily time frame to $38,514. This move has caused the flagship cryptocurrency to tag the demand zone, extending from $37,412 to $39,727. Additionally, the 200-day Simple Moving Average (SMA) at $39,820 has also been breached, a bearish sign as it represents a major shift in trend. Therefore, investors need to keep a close eye on the daily close relative to the 200 SMA.
While the above scenario seems bearish, during its bull run in February, BTC gathered steam around the support area mentioned above and led the run-up from nearly $40,000 to $60,000.
So, a dip into this barrier will allow more buyers to scoop the pioneer cryptocurrency at a discount. Investors can expect a quick bullish reaction that pushes Bitcoin price 15% to tag the swing low created on May 13 at $45,700.
If the buyers overwhelm the bearish pressure, BTC could climb another 12% to tag $51,572.
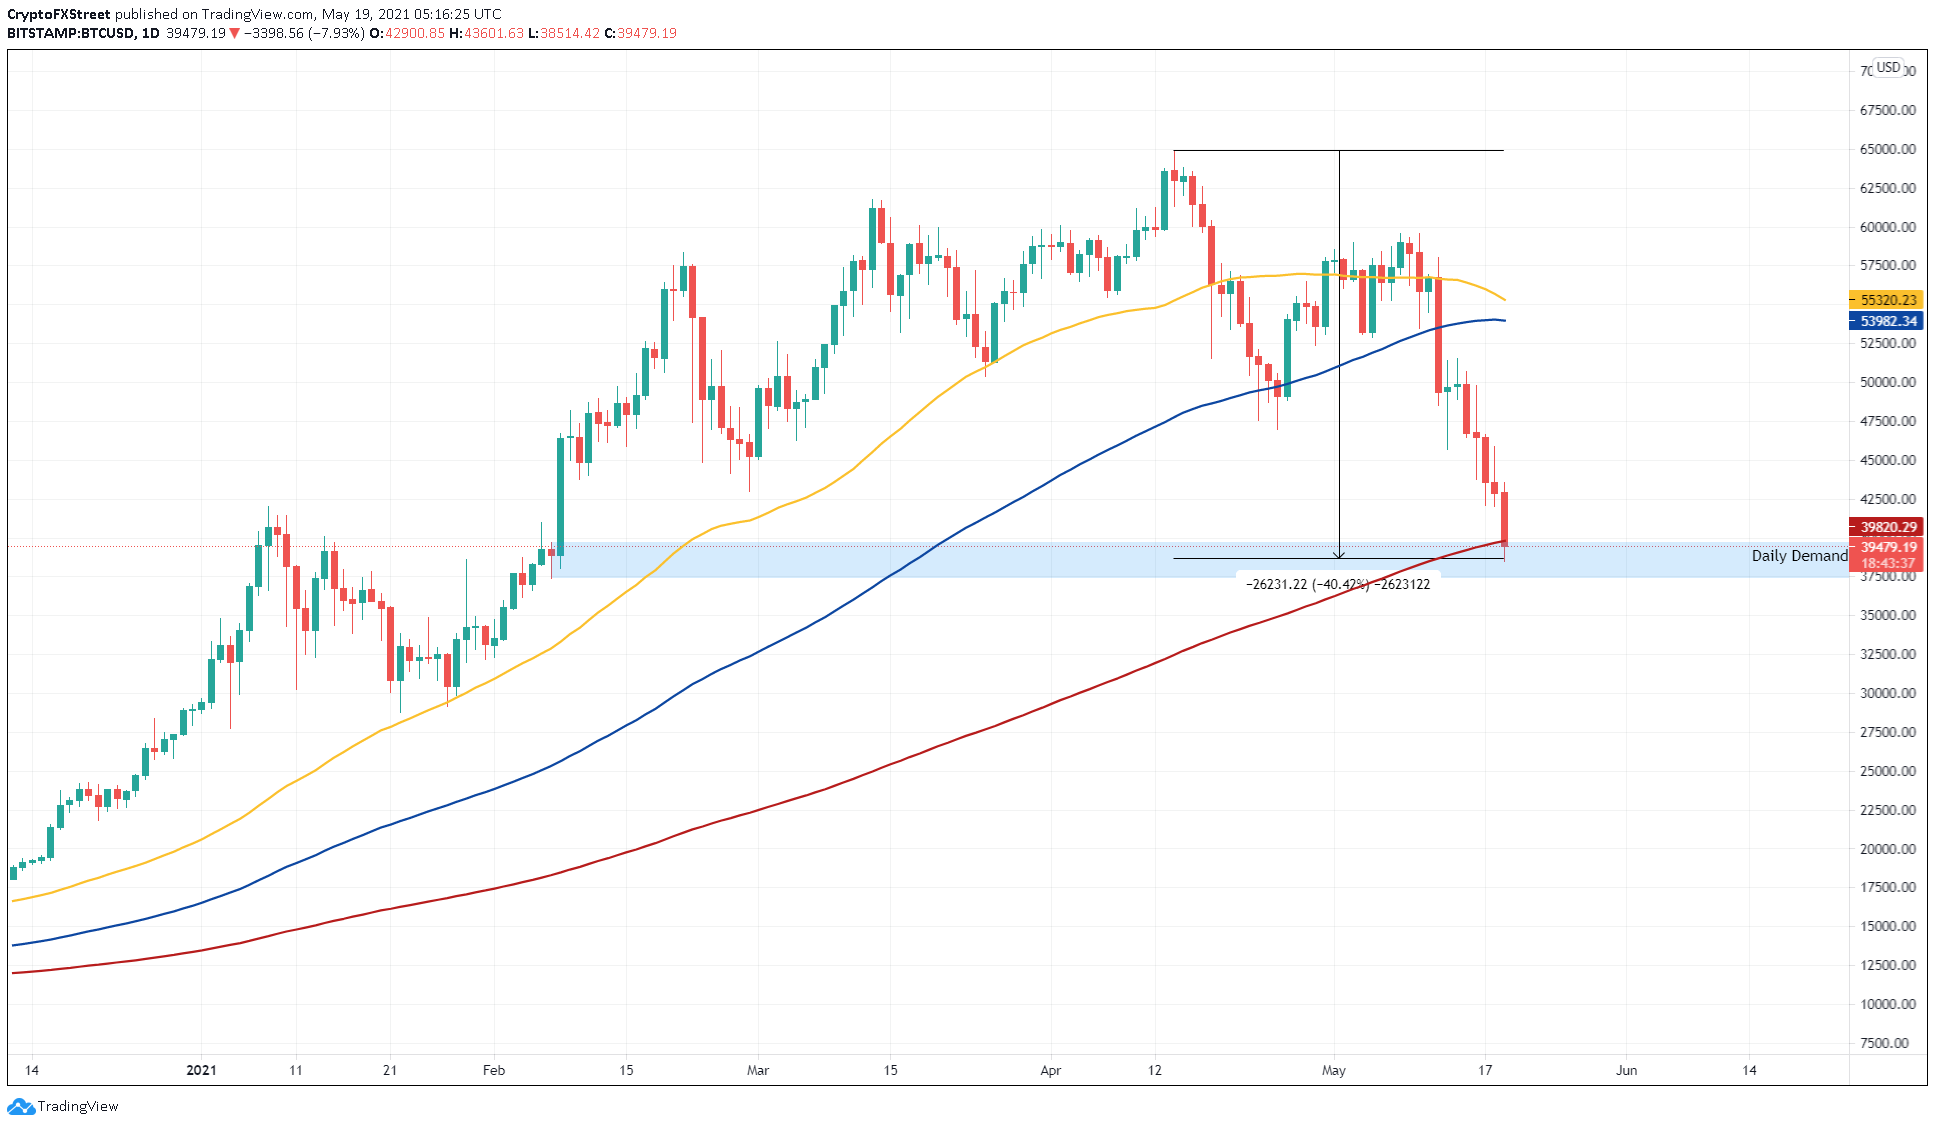
BTC/USD 1-day chart
On the flip side, if the sellers run wild and bulls fail to tame them, Bitcoin price crash will continue. A convincing daily close below $37,412 will invalidate the bullish outlook and trigger an 8% sell-off to $34,245.
Etheruem price shatters $3,000
Ethereum price has been a stellar performer this bull run. However, the recent market sell-off has pushed ETH below $3,000, a significant psychological level. Although this move seems bearish in the short-term, the altcoin pioneer could see a slow down around the 50-day SMA at $2,766.
If the buyers come to the rescue, Ethereum price could find itself bouncing from the level mentioned above. An increase in bullish momentum here could push the smart contract token price by 23% to $3,430, a demand level that helped ETH kick-start its bull rally in early May.
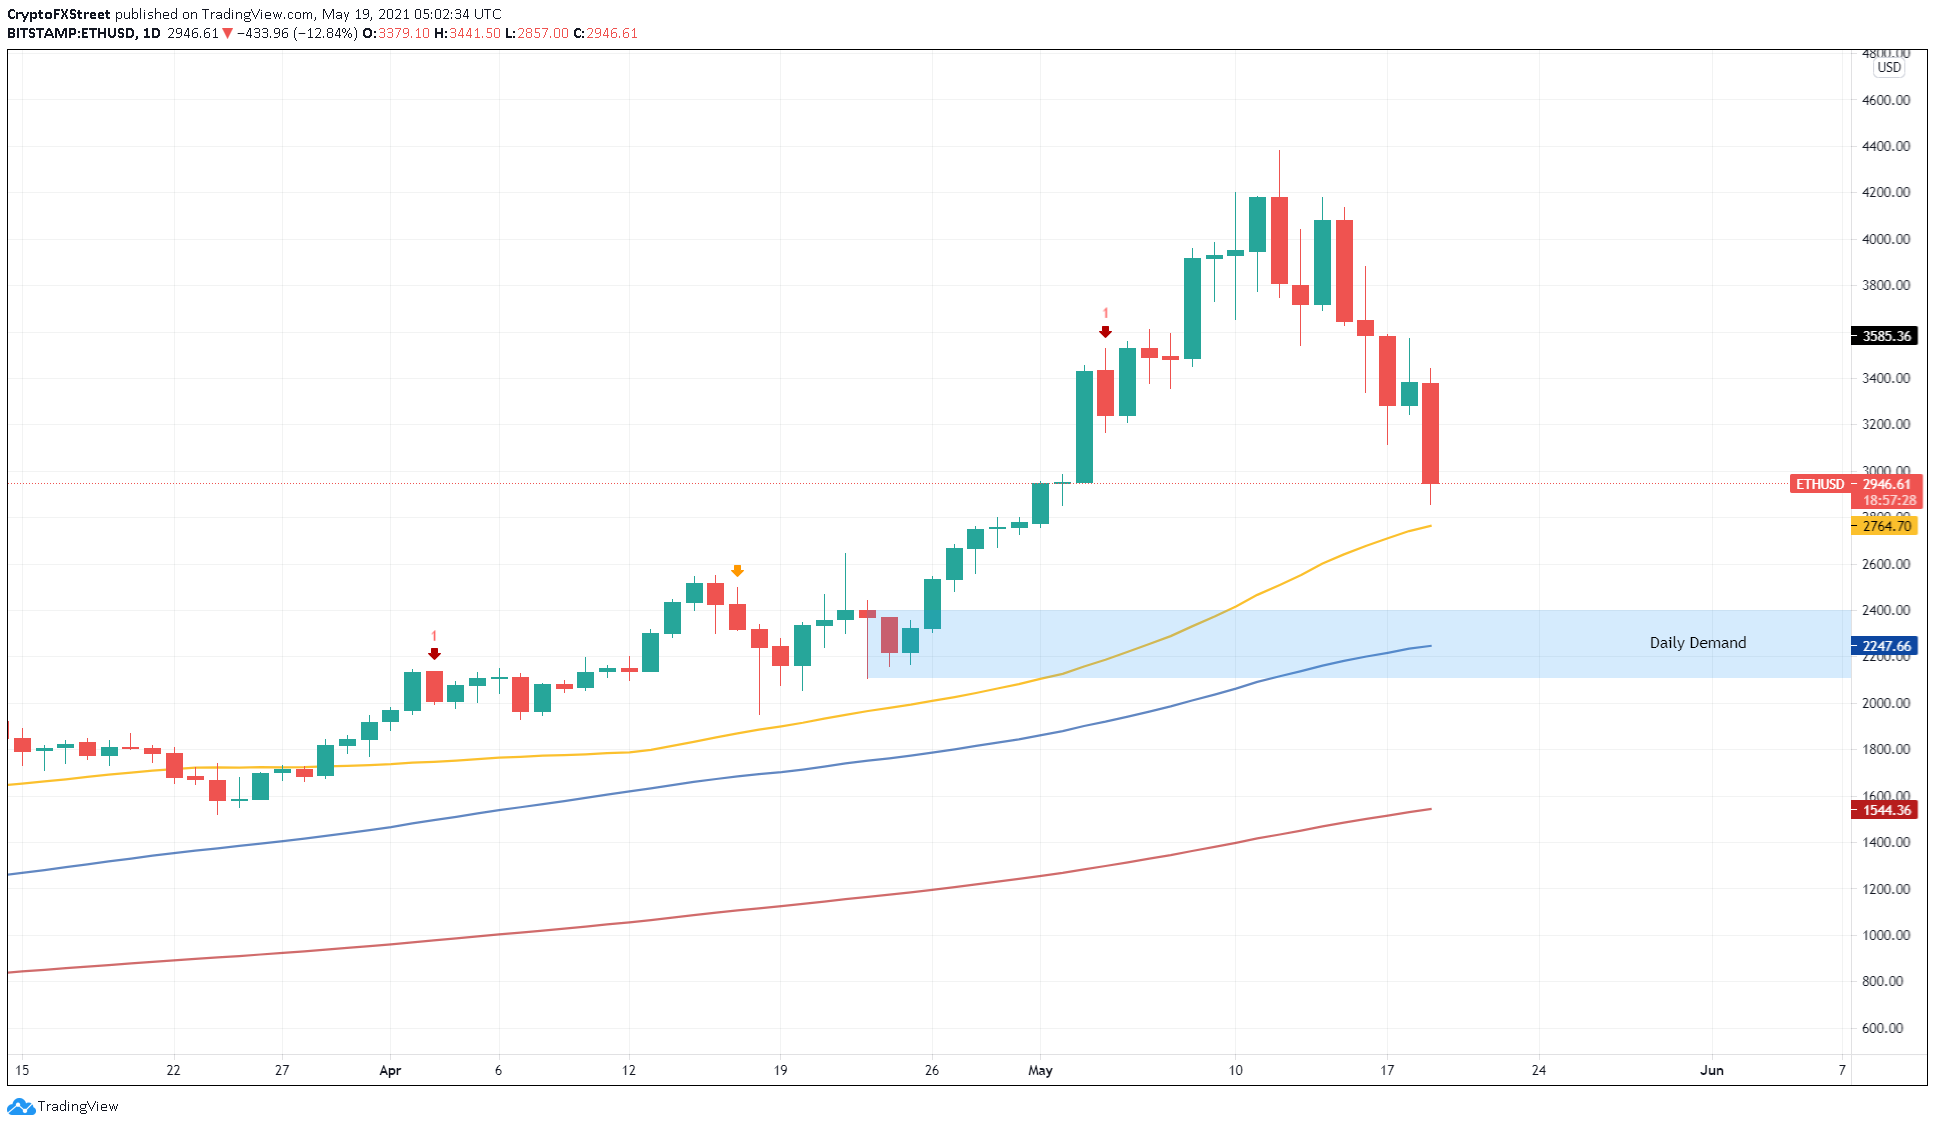
ETH/USD 1-day chart
A breakdown of the 50-day SMA is bearish without a doubt and would lead to a 13% downswing to the daily demand zone, stretching from $2,106 to $2,397. This zone harbors the 100-day SMA at $2,248. Therefore, it is highly likely that the selling pressure will face exhaustion here, leading to a quick 50% upswing to $3.430.
The off chance that ETH price produces a successful daily candlestick close below $2,106 would invalidate the bullish outlook and trigger a 27% crash to the 200-day SMA at $1,544.
Author
FXStreet Team
FXStreet
Composed of a group of economic journalists and FX experts, the FXStreet content team produces and oversees all content published on FXStreet. It provides a purely journalistic approach to the Forex market.


