Top 3 Price Prediction Bitcoin, Ethereum, Ripple: BTC remains unbothered by Fed's diplomatic comments in FOMC
- Bitcoin price maintains an overall uptrend with critical support at $29,000 as the FOMC decision comes as expected.
- Ethereum price requires a substantial push to surpass $1,873 and break from below the 50-day EMA foothold.
- Ripple price faces initial resistance at $0.7237 (50-day EMA) with pullback potential on the three-hour chart.

Bitcoin (BTC) price continues to hover above Monday's low at $28,830, not giving traders an opportunity to get in on the recovery rally. The Federal Open Market Committee (FOMC) meeting failed to induce volatility as chairman Jerome Powell hinted at meeting-by-meeting decisions based on data. This sentiment is shared for Ethereum (ETH) and Ripple (XRP) prices, flashing green with lean margins. The meager surges come as Fed Chairman Jerome Powell committed to a data-dependent approach to interest rate hikes. Despite a sell-off in the US Dollar, Bitcoin price remains rangebound, with little volatility post-FOMC.
Macroeconomics priced in
The little volatility witnessed in the crypto market, pre and post-FOMC, shows that the macroeconomics had already been priced. Notably, traders anticipated the 0.25% rate hike. Since markets tend to react to developments that investors were not expecting, Fed Chair Jerome Powell’s comments today did not move the market. Now crypto has fallen back to regular programming, driven by natural or plain buying and selling activity.
Also Read: Bitcoin and crypto market unphased as FOMC commits to a meeting-by-meeting approach.
Bitcoin Price finds support following FOMC report
Bitcoin (BTC) price on the four-chart exhibits an ascending broadening wedge pattern. The current support level at $29,000 is critical to watch as a breach of this level could signal a potentially bearish scenario. Despite the current support, the overall uptrend remains intact.
Traders should closely monitor the ascending support trendline, which is crucial in determining future price action. However, a bearish scenario may come into play if the price breaks down below the ascending support trendline; the same trendline then acts as a resistance. This would signal a potential trend reversal and indicate a shift from a bullish to bearish market sentiment.
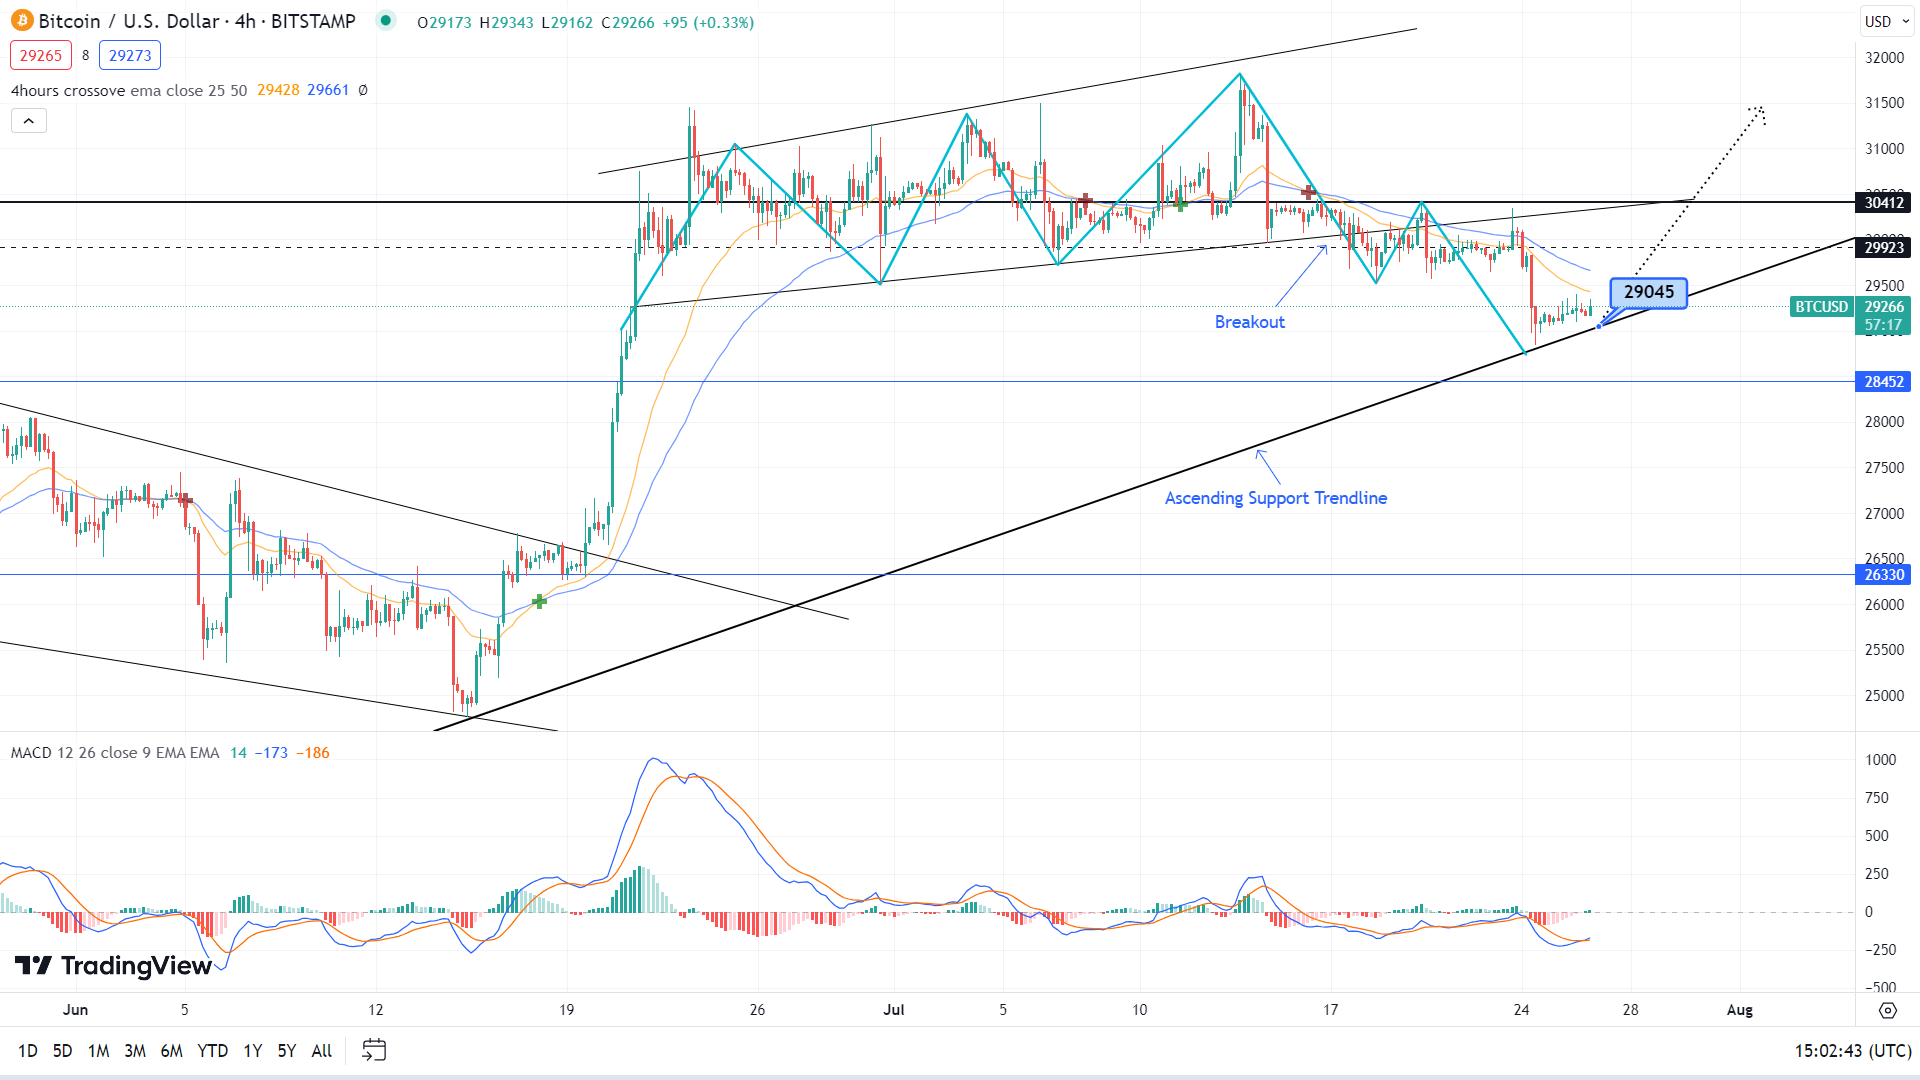
BTC/USDT 4-hour chart
In the event of a breakdown below the trendline, the next important support level for Bitcoin price is $28,452, standing 2.93% below the current price level. A breach of this support may lead to further downside momentum. However, it is worth noting that the Moving Average Convergence Divergence (MACD) histograms have just crossed above the zero line, indicating a recent increase in buying activity, albeit with limited volume.
Also Read: Federal Reserve raises interest rates by 25 bps, Bitcoin price floats above $29,000
Ethereum price faces consolidation as indicators flash bearish
Ethereum (ETH) price for the daily timeframe indicates prices falling below the 50-EMA and encountering resistance at the 38% Fibonacci Retracement level at $1,873. A break and close above this level could potentially change the trend, but technical indicators suggest this is unlikely in the short term. The Awesome Oscillators (AO) histograms show bearish pressure with a red color below the zero line, and the RSI is moving in the middle.
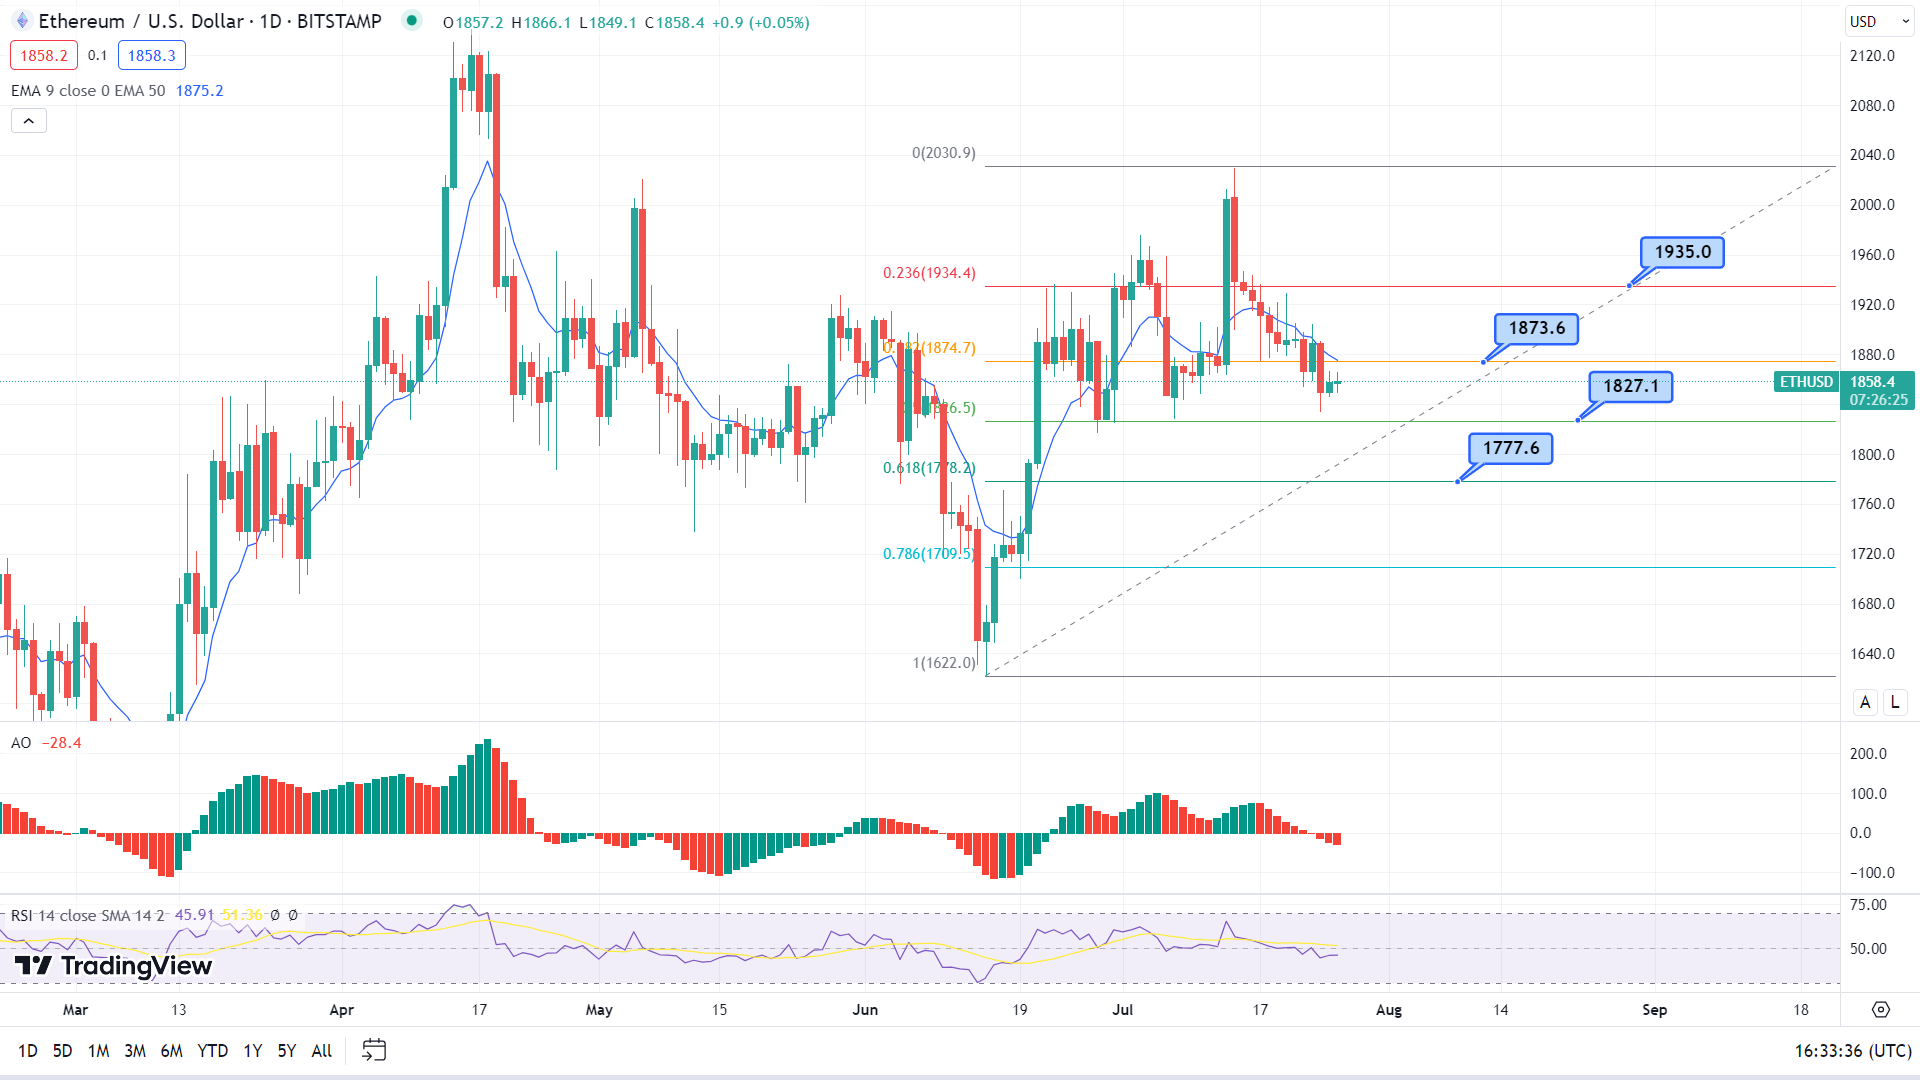
ETH/USD 1-Day Chart
Currently, support is at the 50% Retracement level at $1,827, approximately 1.7% below the current price level. The market seems to be consolidating within the $1,827 and $1,873 range, as the 25 bps rate hike decision of the FOMC has already been priced in.
Also Read: Ethereum classic is looking for more gains
Ripple price faces possible pullback - break and close above 25-EMA
Ripple (XRP) price on the three-hour chart reveals that the remittance token is encountering initial resistance at $0.7128, coinciding with the position of the 25-EMA. A decisive breakthrough and subsequent close above this level could pave the way for further price gains toward the subsequent resistance at $0.7754.
However, the crossover of the higher 50-EMA below the 25-EMA indicates a bearish sentiment, possibly leading to a prolonged consolidation period. In this case, the initial support lies at $0.6673.
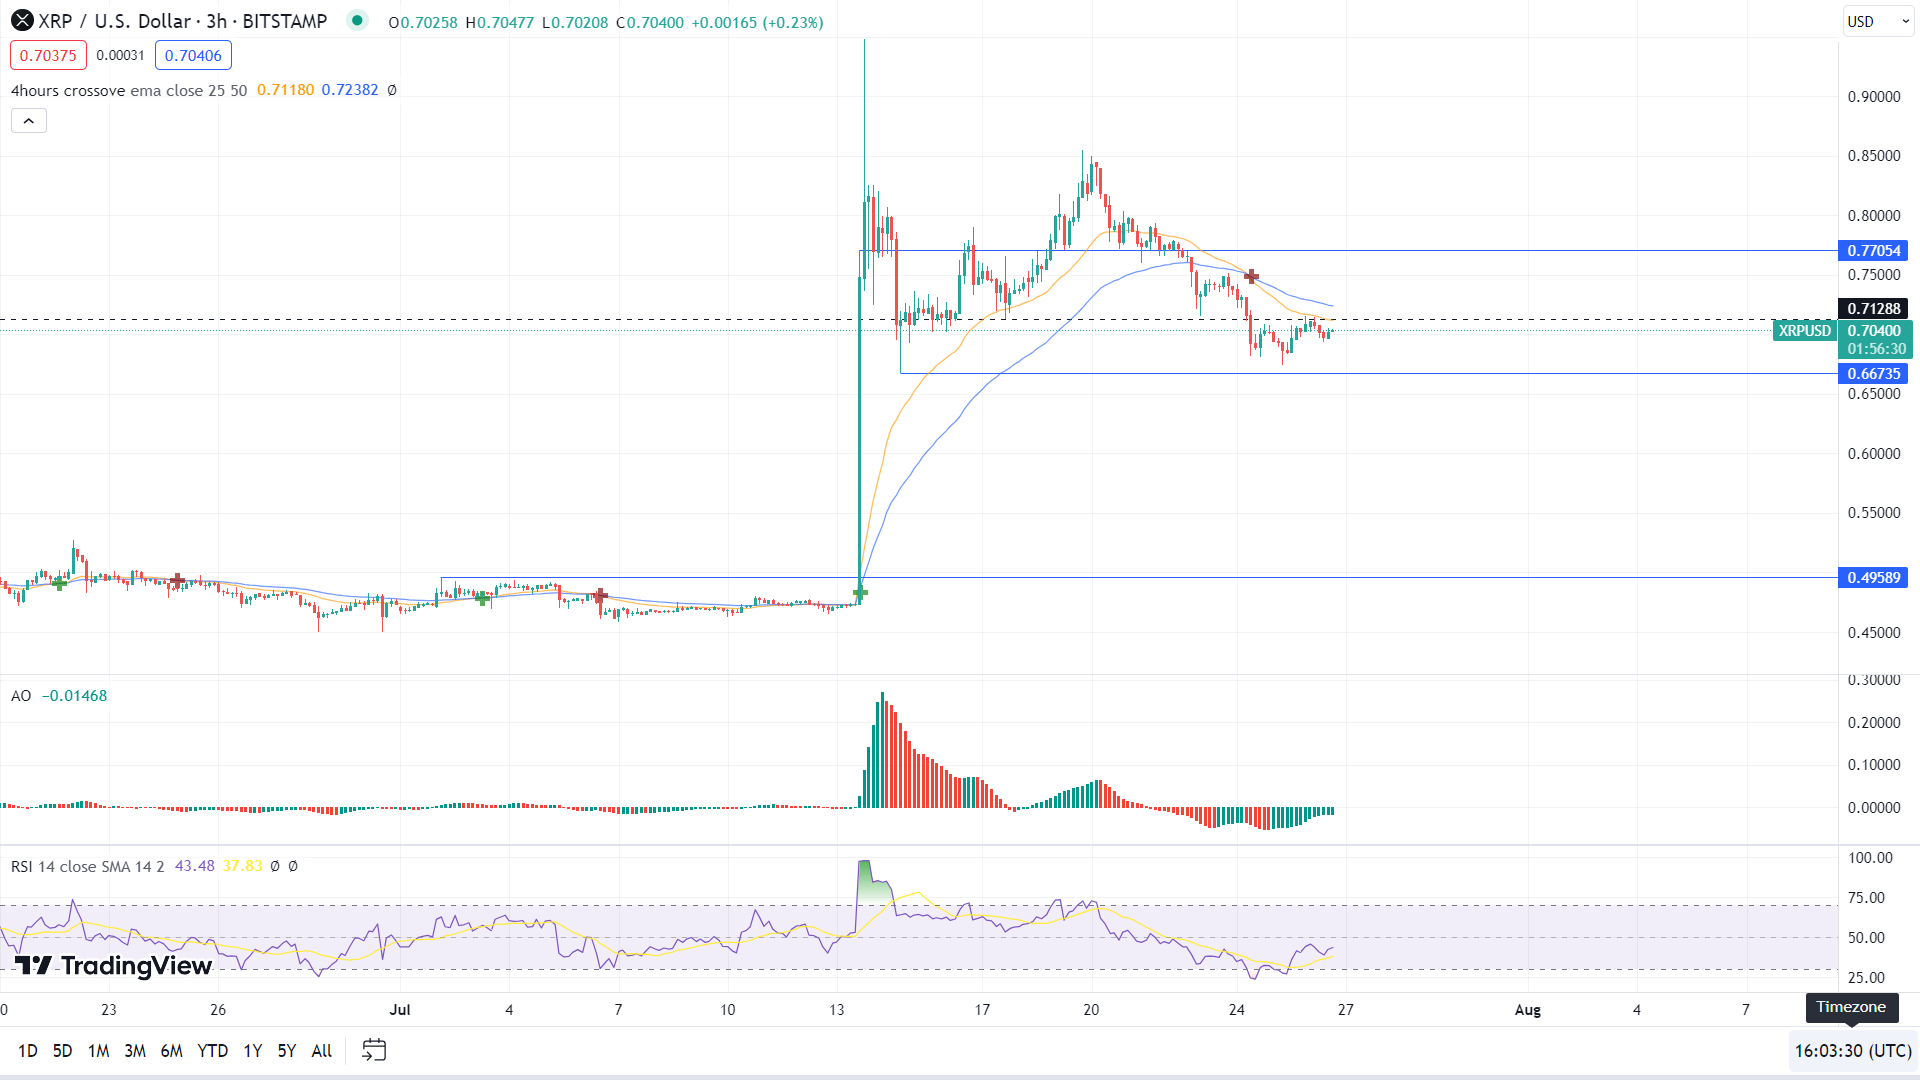
XRP/USD 3-hour chart
Nonetheless, there are indications of buying pressure as depicted by the AO Oscillator histograms displaying green bars, accompanied by the Relative Strength Index (RSI) trending higher. These factors suggest some positive momentum in XRP price movement in the short run. Traders should wait for any closing above $0.7128 to enter long.
Like this article? Help us with some feedback by answering this survey:
Author

Lockridge Okoth
FXStreet
Lockridge is a believer in the transformative power of crypto and the blockchain industry.


