Top 3 Price Prediction Bitcoin, Ethereum, Ripple: BTC breaks crucial support ahead of FOMC meeting
- Bitcoin price could fall 5% to $27,500 after breaking crucial support at $29,872 ahead of the FOMC.
- Ethereum price to test the $1,824 as bears become active below the 200-day EMA at $1,883 on the 4-hour timeframe.
- Ripple price could correct back to move within range after collecting liquidity under $0.711.

Bitcoin (BTC) price continues south after breaking the crucial support. The slump has harmed altcoins, with Ethereum (ETH) and Ripple (XRP) prices bearing the brunt. Meanwhile, the crypto market looks to the oncoming Federal Open Market Committee (FOMC) meeting on Wednesday without much expectation, seeing as its influence on crypto market prices has been rather limited of late.
Also Read: Dogecoin, Shiba Inu, and ApeCoin trade volume spikes as correlation to Bitcoin dwindles
Bitcoin price slides sideways, harming altcoins
Bitcoin (BTC) price has lost crucial support at $29,872 to extend almost 5% lower to a price of $29,090 at the time of writing. The move has seen the king of crypto flip the 50-day Exponential Moving Average (EMA) support into resistance at $29,363 (red). As BTC heads toward the 100-day EMA at $28,344 (green), the bearish outlook points to a retest of the $27,500 level.
The pessimistic outlook is unfortunate considering the oncoming FOMC report, a macroeconomic event that would normally bode well for Bitcoin price if it came as expected. Noteworthy, the previous FOMC indicated the likelihood of a mild recession after the Federal Reserve (Fed) noted a decline in the US Dollar (USD).
BTC and the USD trading inversely to one another, there is a possibility the Fed meeting could impact BTC – even though of late it has had less of an influence. Nevertheless, as reported, a loss of the crucial support at $29,872 would expose Bitcoin price to further losses, potentially tagging the $27,500 support. Such a move would constitute a 5% drop from current levels.
Both the Relative Strength Index (RSI) and the Awesome Oscillators (AO) are headed south, pointing to falling momentum, which augurs well for the bears.
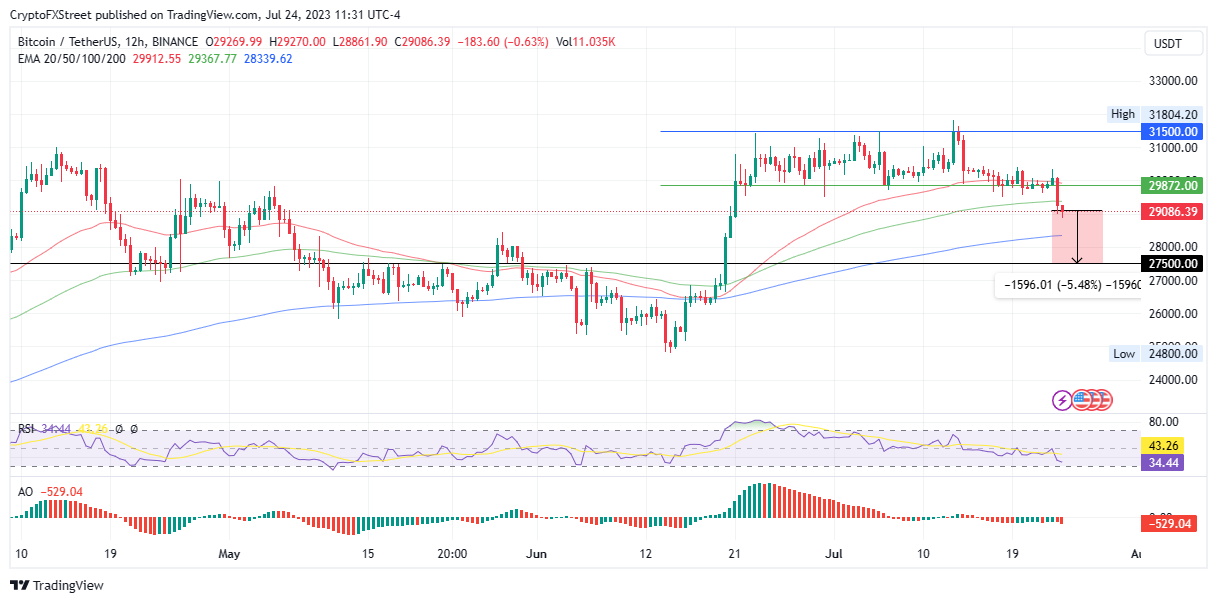
BTC/USDT 12-hour chart
Nevertheless, similar to April 21 and April 25, sidelined investors could choose the $27,500 support as an entry point. The ensuing buying pressure could see the Bitcoin price correct north.
Also Read: Bitcoin Traders Cautious Despite Spot ETF Optimism, Leverage Indicators Suggest
Ethereum price drops as sellers rouse
Ethereum (ETH) price suffers the aftermath of awakened sellers below the 200-day EMA at $1,883 (blue) on the four-hour timeframe. The subsequent selling pressure sent ETH toward $1,824, a crucial multi-month support level.
If the support at $1,824 gives way, Ethereum price could fall 7% to the $1,720 range or lower in the dire case to tag the support floor around the psychological $1,640.
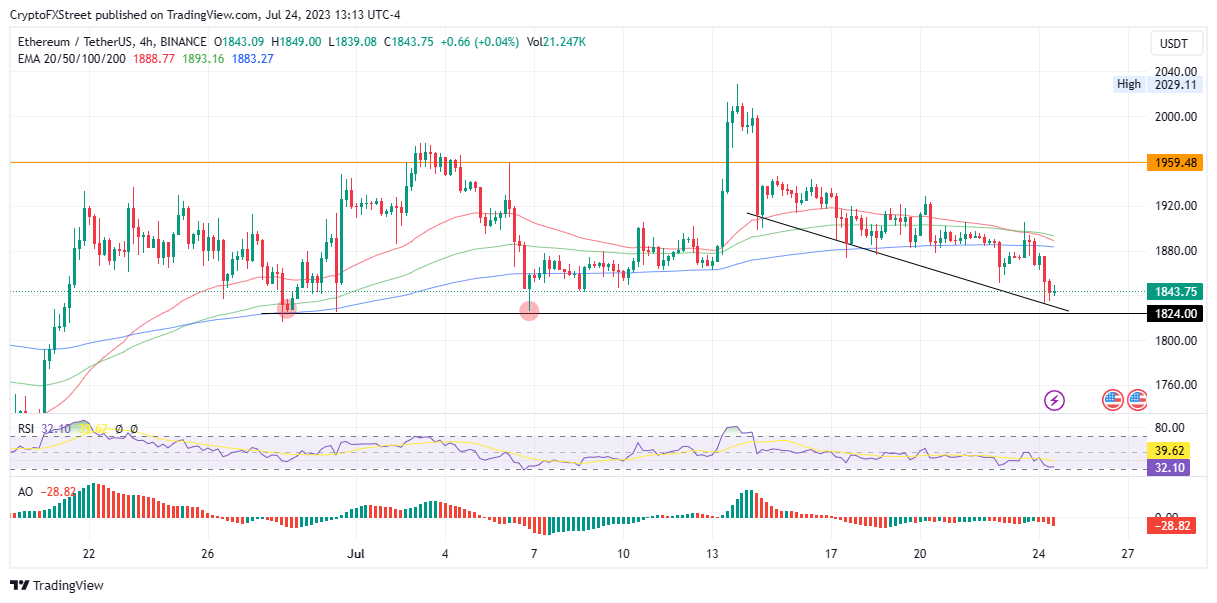
ETH/USDT 4-hour chart
However, a resurgence by the bulls could see Ethereum price bounce from the $1,824 support akin to what happened during late June and early July. Such a move could see ETH regain the ground lost, potentially shattering the $1,959 resistance level. This would constitute a $6 rally north from current levels.
Also Read: Ethereum, Tron, and Bitcoin worth $23 million drained from Alphapo hot wallets
Ripple price could pull back after collecting liquidity
Ripple (XRP) price has broken below the support at $0.711, a move that appears to be a successful attempt to collect buy-side liquidity hanging after volatility following the July 13 rally. Liquidity collection often stabilizes the market for a few days before the asset continues its overall trend.
Accordingly, Ripple price could restore north to move within range. However, XRP could extend even further north in a highly bullish case, breaching the $0.823 resistance level. This would denote a 20% rise from current levels.
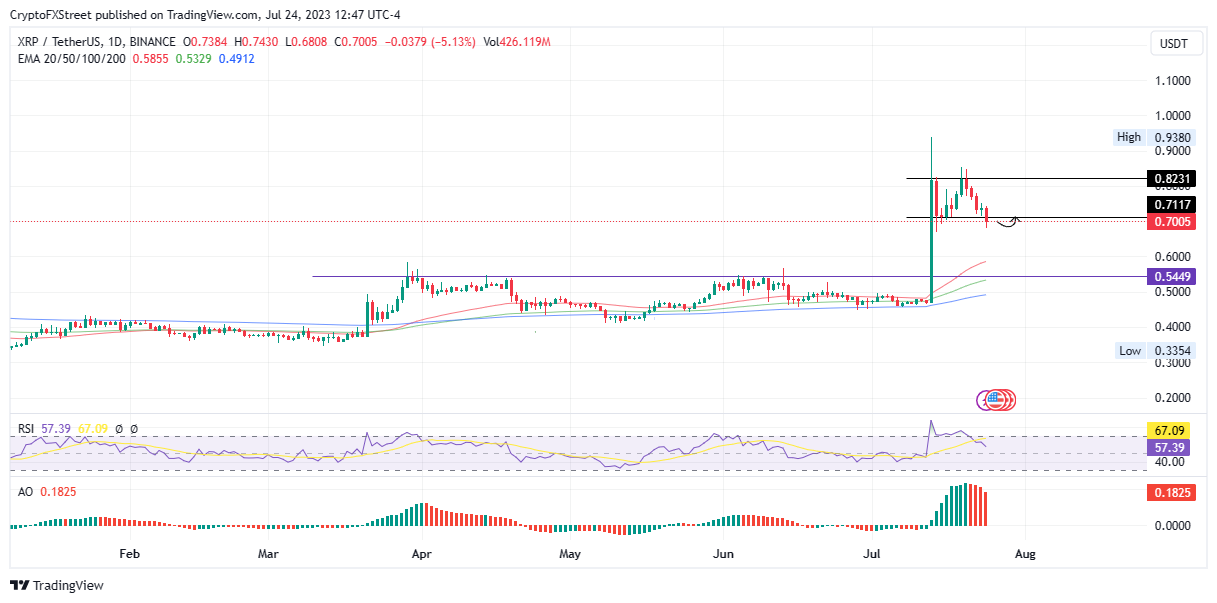
XRP/USDT 1-Day Chart
Nevertheless, with the RSI heading south and AO histograms soaked red, bears are gaining ground, and Ripple price could rally south toward the $0.544 level.
Also Read: Pro-XRP John Deaton argues SEC vs. Ripple ruling is sound, cites Celsius bankruptcy example
Like this article? Help us with some feedback by answering this survey:
Author

Lockridge Okoth
FXStreet
Lockridge is a believer in the transformative power of crypto and the blockchain industry.


