Top 3 Price Prediction Bitcoin, Ethereum, Ripple: Tailwinds abound for BTC as Google suggests ETF readiness
- Bitcoin price could lose critical support at $40,000 as RSI confirms BTC is ripe for selling.
- Ethereum price clings firm to the uptrend and records a healthy pullback as $2,147 support continues to hold.
- Ripple price risks an extended 7% fall to the $0.5773 support level as XRP bulls show weakness.

Bitcoin (BTC) price remains bullish despite the catastrophic setback recorded during the early trading hours of the Asian session. While several other narratives support the big-picture bullish outlook, spot exchange-traded funds (ETFs) have a role to play in it.
As traders and investors continue to anticipate the US Securities and Exchange Commission (SEC) giving approvals for the product launches between January 5 and 10, even Google has taken a hint. An official announcement reveals that "advertisers offering Cryptocurrency Coin Trust targeting the United States [will be allowed] to advertise those products and services" beginning January 29, 2024. Notably, this is the same month that spot Bitcoin exchange-traded funds (ETFs) are expected to gain approval in the US.
Bitcoin price delivers a healthy retest
Bitcoin (BTC) price folding back to record an intra-day low of $40,400 was a healthy retest as the $40,000 psychological level continues to hold as support. If the level holds, then it could precipitate the idea that new all-time highs are in the cards.
Meanwhile, the upside potential remains strong for Bitcoin price as BTC is still not ripe for selling until the Relative Strength Index (RSI) crosses below the 70 level. With the Awesome Oscillator (AO) showing large volumes of green histogram bars, the bulls still maintain a strong presence in the market though. The RSI could simply hold above 70.
Increased buying pressure above current levels could see Bitcoin price overcome the weekly supply zone extending from $40,698 to $46,999. A weekly candlestick close above the $43,860 mean threshold would confirm the continuation of the primary trend.
Such a move would set the tone for Bitcoin price to flip the supply zone into a bullish breaker, confirmed by a move above the $48,725 resistance level.In a highly bullish case, Bitcoin price could extend to tag the $66,098 resistance level into a support floor.
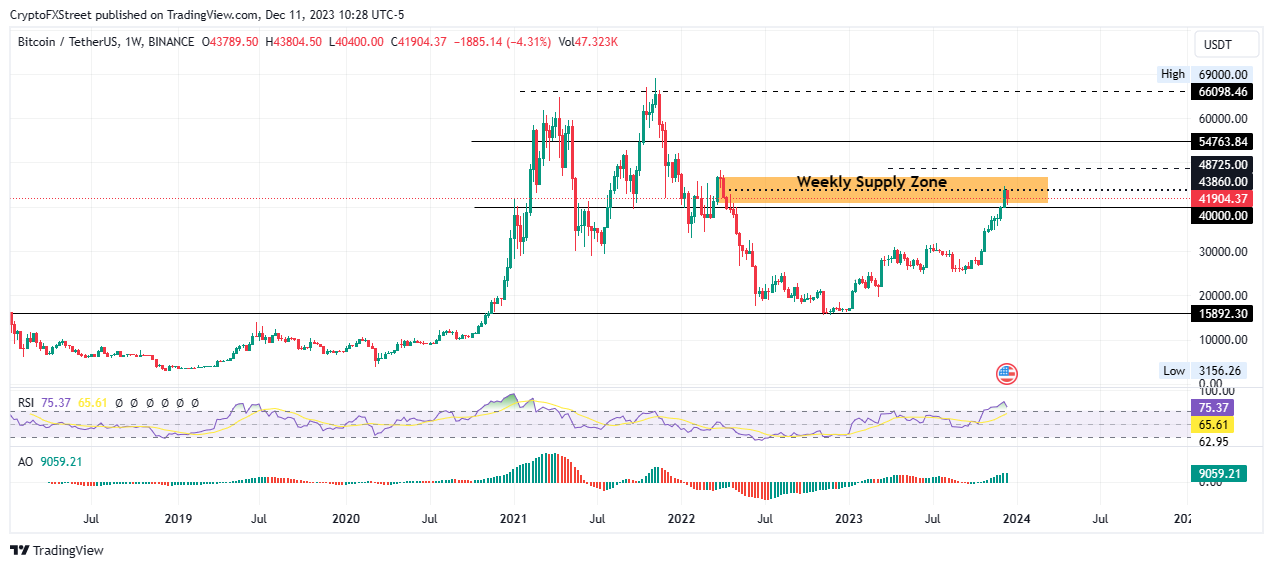
BTC/USDT 1-week chart
Conversely, if the weekly supply zone defends as a resistance order block, Bitcoin price could pull south, losing the support at $40,000. A decisive weekly candlestick close below this level would put BTC on the cliff, potentially rolling over to the $30,000 psychological level.
Also Read: Bitcoin braces for volatility-filled week with November CPI data release, Fed decision
Ethereum price sell-off threatens upside potential
Ethereum (ETH) price also crashed alongside Bitcoin, losing almost 9% in market value. However, the move remains a healthy pullback as the $2,147 support level did not break. As long as ETH remains above the $2,000 psychological level, the upside potential remains alive.
Increased buying pressure could see Ethereum price clear the $2,403 range high even as it continues to consolidate within the confines of an ascending parallel channel.

ETH/USDT 1-day chart
On the flipside, increased seller momentum could plunge Ethereum price out of the bullish chart pattern, confirmed by a break and close below critical $2,147 support. ETH might then confirm the continuation of the fall by breaking and closing below the midline of the supply zone turned bullish breaker at $2,075. The move could clear the path for the largest altcoin by market capitalization to spiral to the $2,000 psychological level.
Also Read: Ethereum leads altcoins north as Bitcoin halts amid bull trap fears
Ripple price risks a 7% fall
Ripple (XRP) price started the week with a 10% pullback that could culminate in a prolonged slump, potentially extending 7% to the $0.5773 support level. The RSI position below 50 and overall inclination to the south show momentum is fading.
Increased selling pressure could see Ripple price extrapolate the fall to the $0.5000 psychological level, standing almost 20% below current levels.
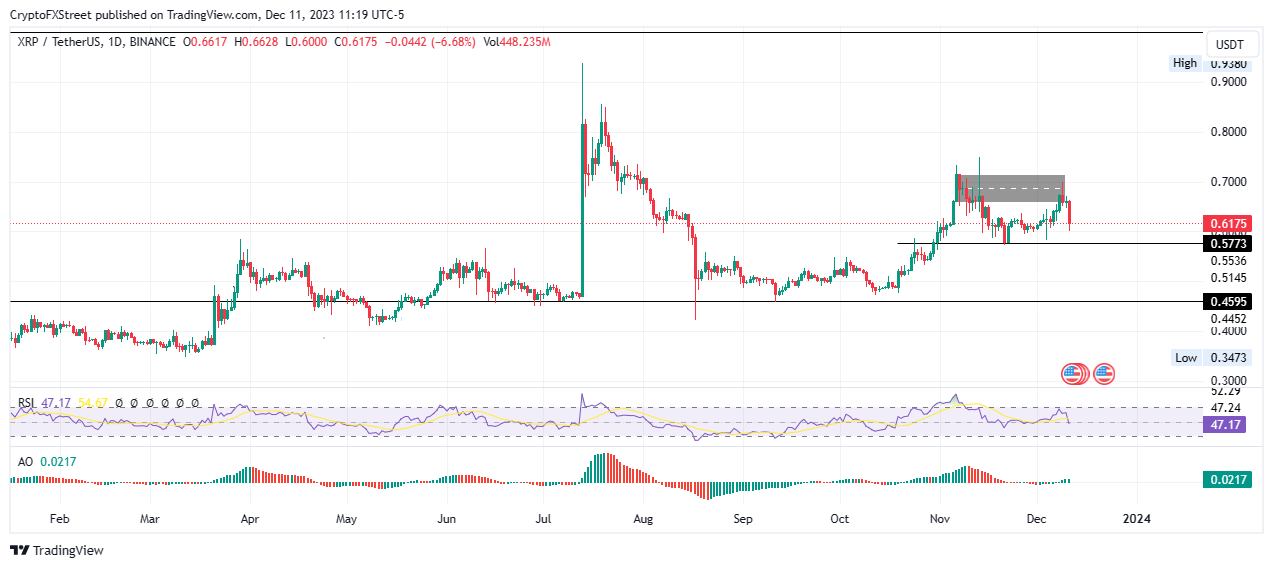
XRP/USDT 1-day chart
On the other hand, if sidelined or late investors approach the scene, Ripple price could make a second go at the supply zone extending from $0.6572 to $0.7161, confirmed by a break and close above the $0.6850 midline.
In a highly bullish case, Ripple price could forge higher, going as far as the $0.8000 psychological level. Such a move would denote a 30% climb above current levels.
Also Read: Ripple is now only 3% away from becoming a bigger entity than Binance Coin
Author

Lockridge Okoth
FXStreet
Lockridge is a believer in the transformative power of crypto and the blockchain industry.


