Top 3 Price Prediction Bitcoin, Ethereum, Ripple: BTC confirms the shifting sentiment in the crypto ecosystem
- Bitcoin price is attempting a reach for the $31,000 high after a 12.29% rally this week, analysts speculate a $35,000 target.
- Ethereum price could reach $1,941 if ETH leverages the BTC rally for a 5% climb to complete the V-shaped recovery.
- Ripple price eyes the $0.50 target, but a highly bullish case proposes 10% gains to the $.055 range high.

Bitcoin (BTC) price ended its two-month-long downtrend when it broke above the $30,000 mark on Wednesday before a brief pullback. The uptick has inspired a general boom among cryptocurrencies, with Ethereum (ETH) and Ripple (XRP) prices tagging along. Experts have explained the mega rally as a market reaction to spot Bitcoin ETF filings by giant financial institutions like BlackRock and Wisdom Tree.
Also Read: Bitcoin price breaches $30,000 on Binance, three catalysts power mega rally
Bitcoin price gains momentum as $35,000 comes into sight
Bitcoin (BTC) price is up 22% from mid-June lows around $24,900 and 12.29% this week. The rising momentum comes amid institutional investors showing a growing interest in and recognition of BTC. Moreover, the subsequent filings by two of the biggest institutional investors underscore the increasing recognition of the potential of Bitcoin in traditional finance. These applications acknowledge the industry's demand for regulated investment vehicles and could pave the way for broader adoption.
After crossing the $30,000 mark, Bitcoin price is aiming for the range high of $31,000, a reach that could see the flagship crypto reclaim the mid-April highs. A decisive candlestick close above the $31,000 level could clear the path for a 15% rally to analysts' ambitious target of $35,000.
The Relative Strength Index (RSI) pointing north shows a rising momentum among buyers. Similarly, the steady rise of the green histograms to the positive zone above the midline shows that bulls are leading the BTC market.
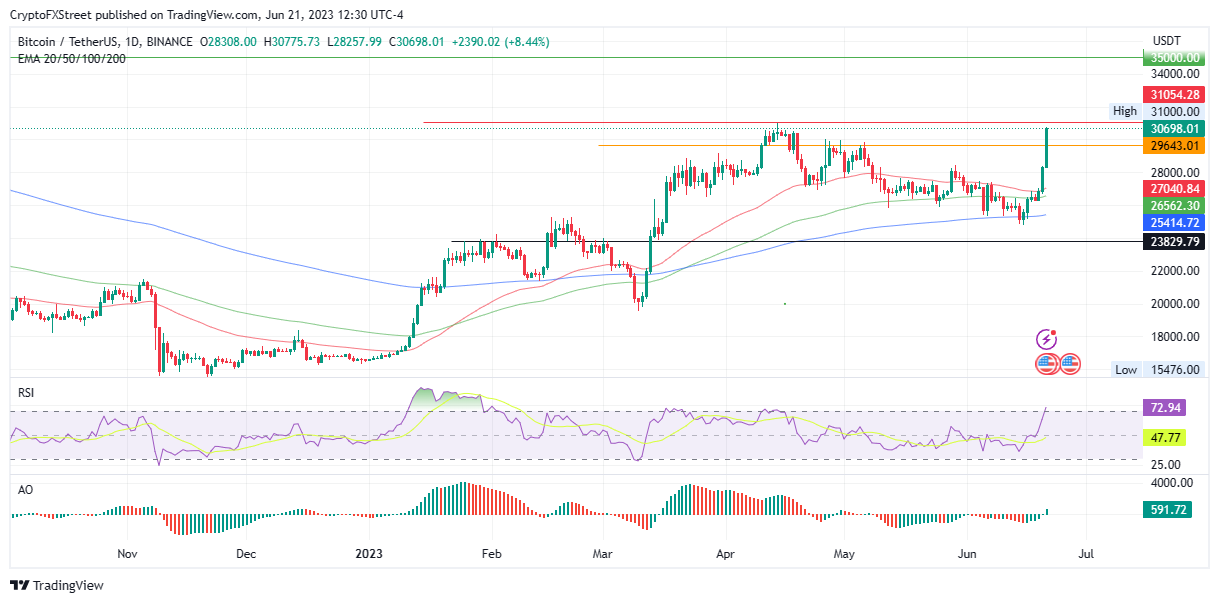
BTC/USDT 1-Day Chart
Conversely, the RSI position at 72 shows that BTC is overbought, a situation often preceding a pullback. If this happens, Bitcoin price could repel the $31,000 high akin to what happened on April 14.
Also Read: Bitcoin dominance hits two-year high at 51%, jeopardizing altcoin gains
Ethereum price could rise 5% if the BTC rally sustains
Ethereum (ETH) price is reaping the gains from the BTC rally, recording a daily rise of 5% and a weekly rise of 15%. Based on the ETH/USDT daily chart below, the PoS token is headed north and could reach $1,941 soon in a move constituting a 5% ascent.
This optimistic outlook is supported by the RSI pointing north, suggesting a rising momentum. Notably, its position at 58 was promising as it indicated there was more room upward for ETH to rise. Also, the AO indicator was soaked in green and edging toward the midline, showing bullish muscle that could soon overpower the bears.
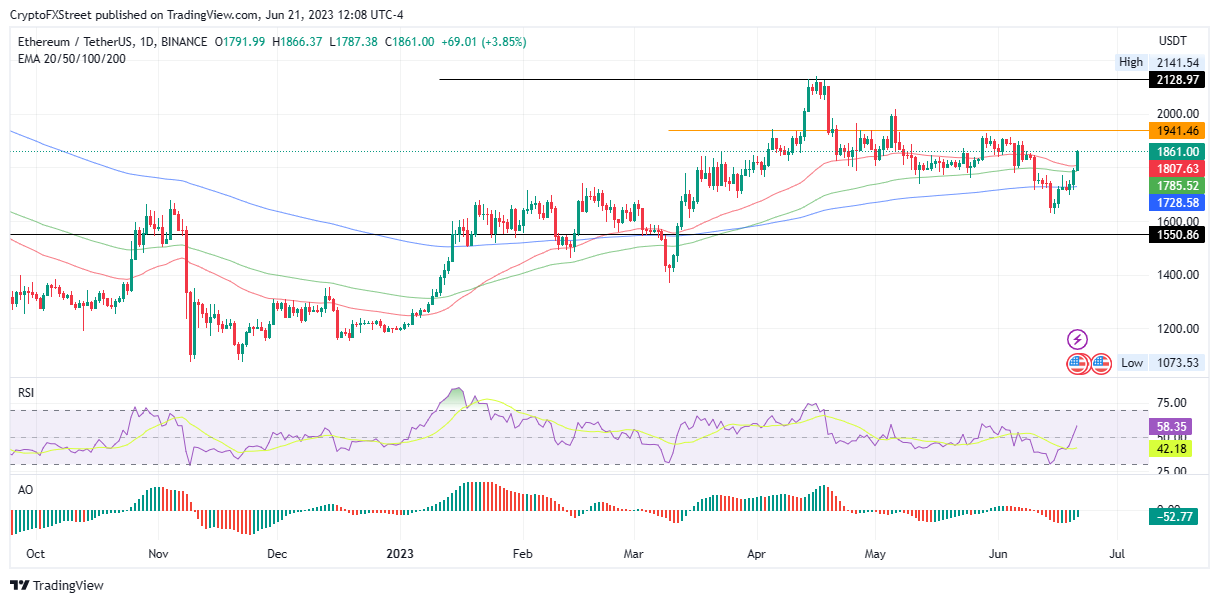
ETH/USDT 1-Day Chart
On the flipside, if Bitcoin price shows exhaustion, it could interrupt the ETH rally causing Ethereum price to fall. Such an outcome could see the largest altcoin fall below the 50-day Exponential Moving Average (EMA).
In the dire case, Ethereum price could fall below the 100-and 200-day EMA at $1,785 and $1,728, respectively, before a possible leg south to the June 15 low of around $1,650.
Also Read: Ethereum Layer 2 Optimism beats MATIC to the curb, sees massive spike in active addresses
Ripple price must flip the supply zone into a breaker to reach its target
Ripple (XRP) price is trading with a bullish bias, recording 6% gains on the day. Nevertheless, while the broader market enjoys the overflows of the BTC rally, XRP shows indecisiveness, with neither buyers nor sellers acting out. This is because of the dark clouds above presented by the supply zone between $0.528 and $0.520.
A supply zone is a large area of resistance defined by a population of sellers. Notably, XRP bulls keeping their selling appetite in check could transform this seller congestion zone into a breaker block, interpreted as a failed order block (failed supply or demand zone).
Ripple price could ascend toward the said zone, bolstered by the call to buy XRP that the RSI was gearing up for, authenticated once the momentum indicator crosses above the signal line (yellow).
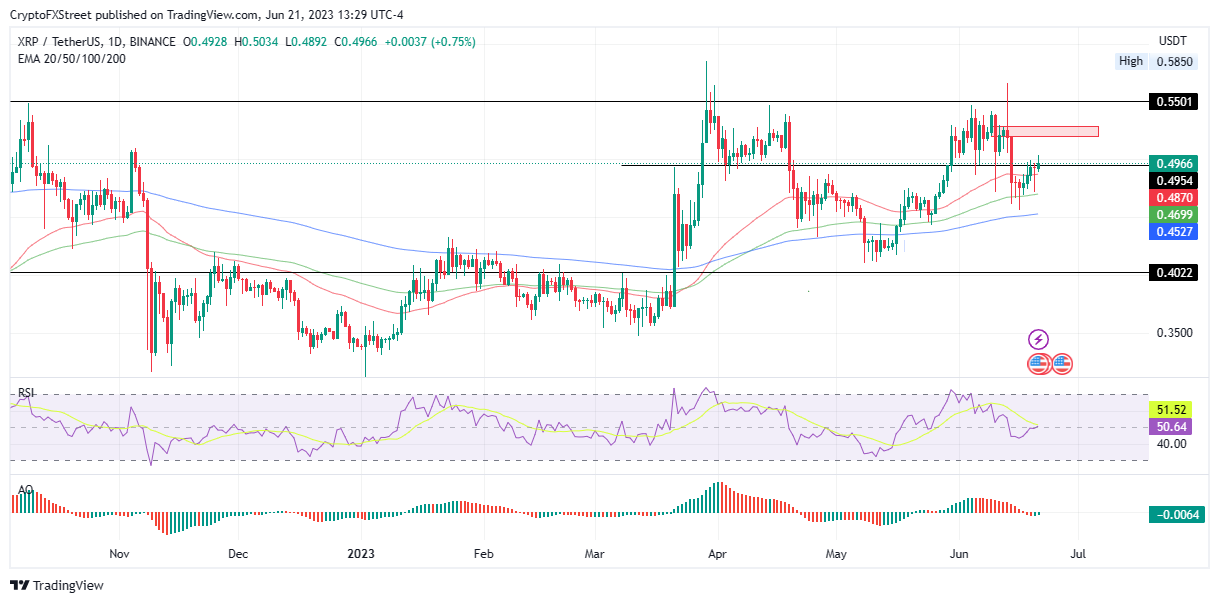
XRP/USDT 1-Day Chart
However, selling pressure from the supply zone could repel Ripple price, causing it to flip the 50-day EMA at 0.487 from support into resistance. In the dire case, XRP could lose the 100- and 200-day EMA supports at $0.469 and $0.452, respectively.
Also Read: Pro Ripple attorney John Deaton finds legal provision that could have avoided SEC lawsuit
Author

Lockridge Okoth
FXStreet
Lockridge is a believer in the transformative power of crypto and the blockchain industry.



