Top 3 Price Prediction Bitcoin, Ethereum, Ripple: Bitcoin technical indicators signal bullish momentum
- Bitcoin price action shows a bullish divergence on a momentum indicator.
- Ethereum price finds support around $3,362 price low from Friday.
- Ripple price faces rejection by its daily resistance level of $0.499 level.

Bitcoin (BTC) price action shows a bullish divergence on a momentum indicator, signaling a forthcoming bullish trend. Ethereum (ETH) and Ripple (XRP) are poised to mirror Bitcoin's trajectory, preparing to breach resistance levels and rally upwards in tandem.
Bitcoin price action indicates bullish momentum
Bitcoin price was rejected by the weekly resistance level of $67,147 on Monday and fell by 2.2%. BTC is currently supported by its 50% retracement level at $64,274, calculated from the swing low of $56,523 on May 1 to a swing high of $71,995 on May 21.
If BTC bounces off $64,274, it could rally 4% to reach its previous resistance level of $67,147.
The Relative Strength Index (RSI) and the Awesome Oscillator (AO) support this aforementioned bounce. The lower low formed in the 4-chart on June 18 does not reflect the RSI's higher high for the same period. This development is termed a bullish divergence and often leads to the reversal of the trend or a short-term rally.
If the bulls are aggressive and the overall crypto market outlook is positive, then BTC could extend an additional rally of 6% to reach its previous resistance level of $71,280.
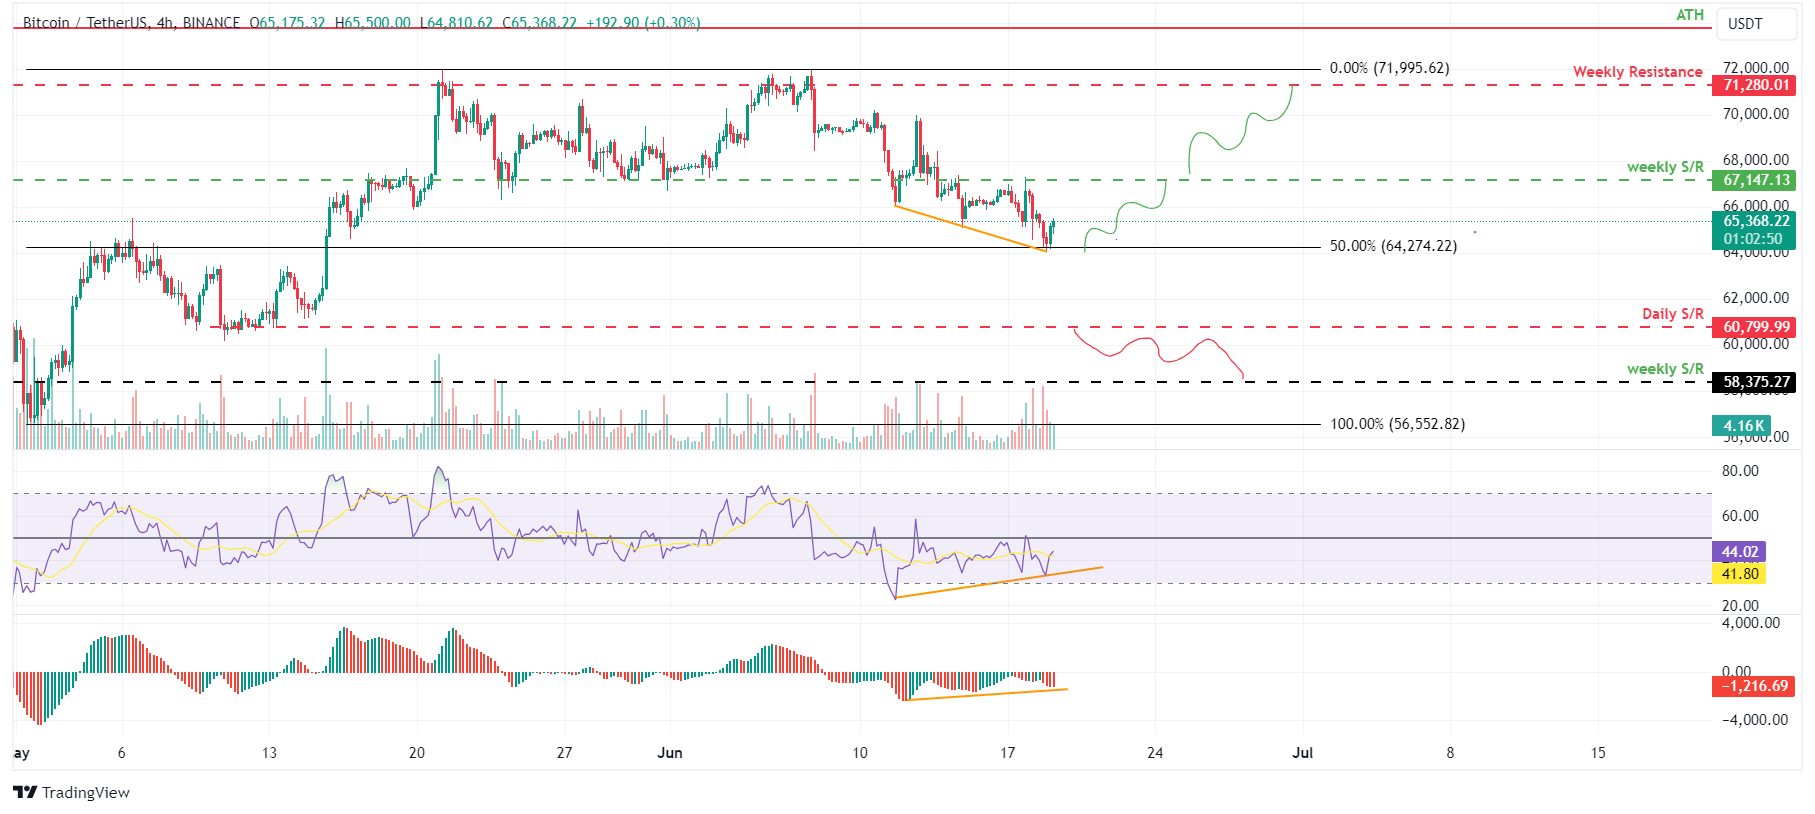
BTC/USDT 4-hour chart
However, if Bitcoin's price breaks and closes below its daily support level of $60,800, the bullish thesis would be invalidated, leading to a 4% decline , its weekly support level of $58,375.
Ethereum price shows potential for a rally
Ethereum price finds support around Friday's low of $3,360, which is currently trading at $3,533. The $3,360 low roughly hovers the 61.8% Fibonacci retracement level at $3,279.
If this support holds, then ETH price could rally 3% from its current trading price of $3,533 to tag its previous high of $3,717 on June 9.
The Relative Strength Index (RSI) breaks above its mean level of 50 in the 4-hour chart, and the Awesome Oscillator (AO) is on its way to doing the same. If bulls are indeed making a comeback, then both momentum indicators need to maintain their positions above their respective mean levels. Such a development would add a tailwind to the recovery rally.
If ETH closes above $3,717, it could extend an additional rally of 6% to reach its previous resistance level of $3,977.
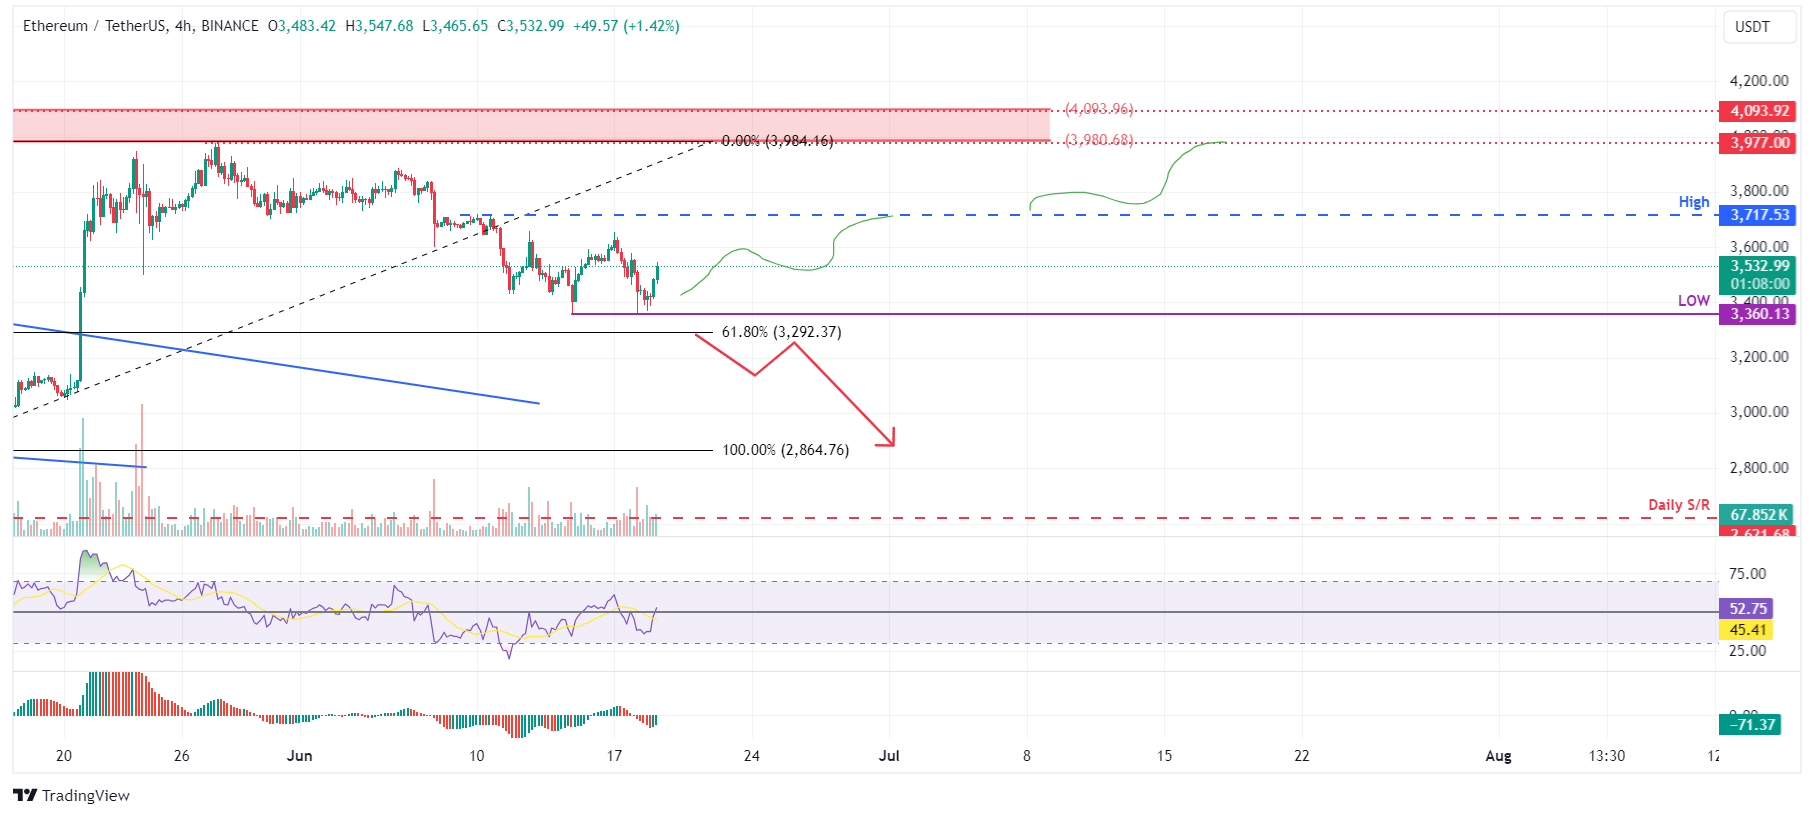
ETH/USDT 4-hour chart
On the other hand, if Ethereum's daily candlestick price closes below the $3,292 level, it would produce a lower low and signal a break in the market structure. This move would invalidate the aforementioned bullish thesis, potentially triggering an extra 13% crash to the previous support level of $2,864.
Ripple price poised for a breakout
Ripple's price faced resistance at $0.515, its 50-day Exponential Moving Average (EMA), on Monday and fell by 3%. XRP is currently trading at $0.495.
If Ripple price breaks above the 50-day EMA at $0.515, it could rise 7% from $0.499 to $0.532, its previous high from June 5.
The Relative Strength Index (RSI) in the daily chart is below the 50 mean level, while the Awesome Oscillator (AO) is below its zero line. If bulls are indeed making a comeback, then both momentum indicators need to maintain their positions above their respective mean levels of 50 and zero. Such a development would boost the recovery rally.
If the bulls are aggressive and the overall crypto-market outlook is positive, the XRP price could extend an additional 9% to $0.581, a 50% price retracement level of $0.419 and $0.744 from March 11 to April 13.
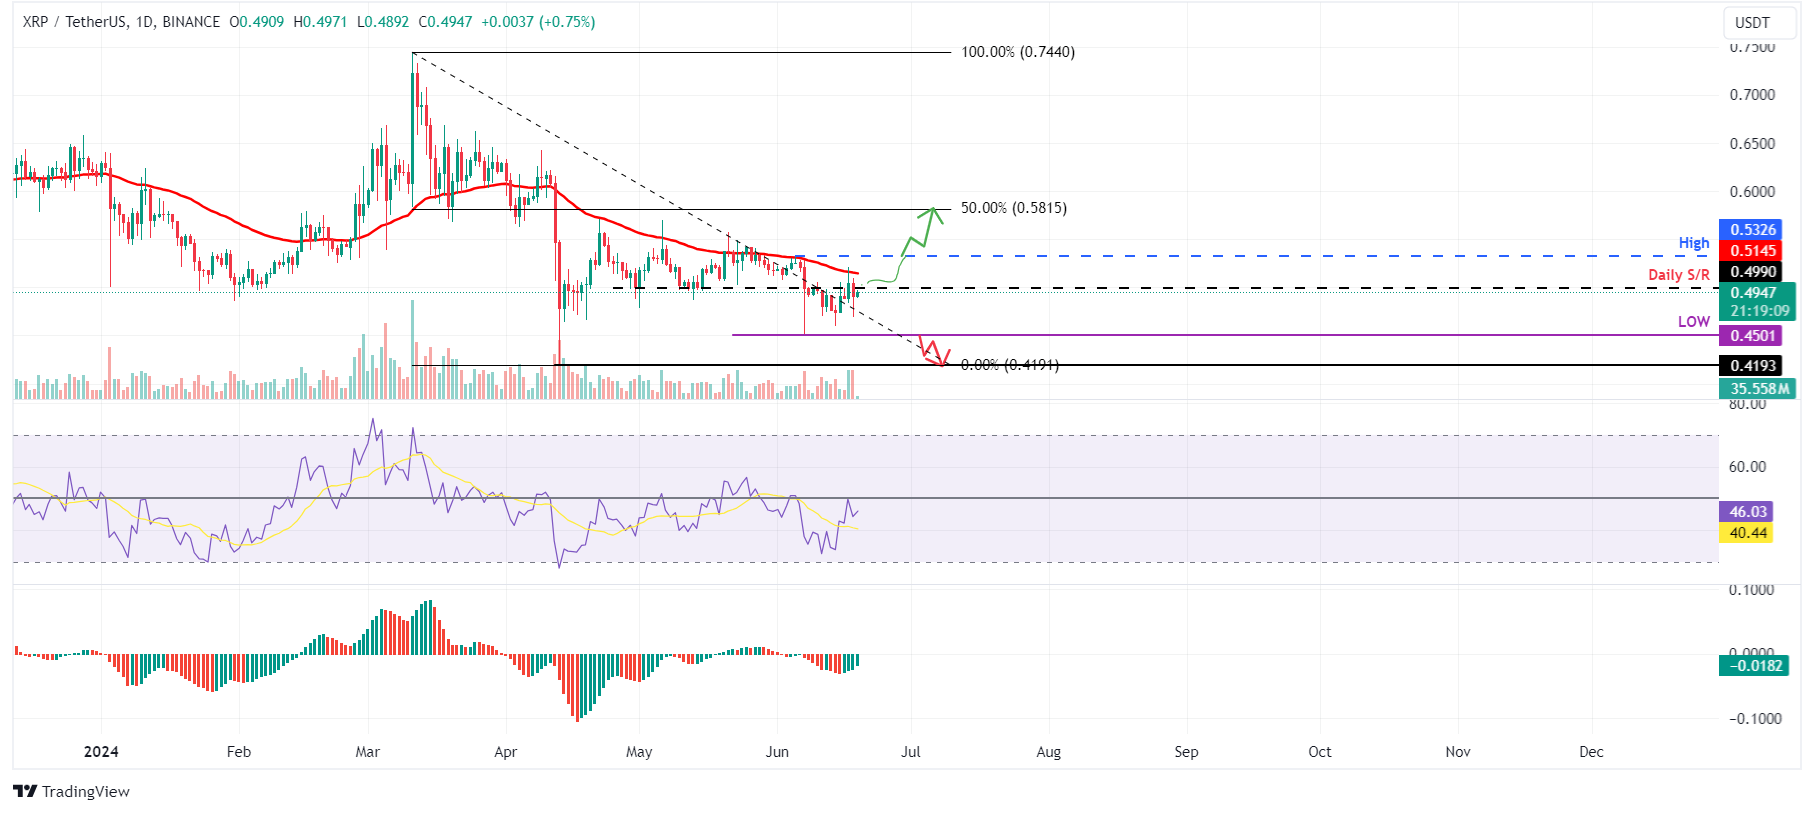
XRP/USDT 1-day chart
On the other hand, if Ripple's price produces a daily candlestick close below $0.450, the daily low from June 7, the move would invalidate the bullish thesis by making a lower low on the daily time frame. This development could see XRP's price decline 7% to the April 13 low of $0.419.
Author

Manish Chhetri
FXStreet
Manish Chhetri is a crypto specialist with over four years of experience in the cryptocurrency industry.


