Top 3 Price Prediction Bitcoin, Ethereum, Ripple: Bitcoin takeoff to $50,000 gestures as altcoin season teases
- Bitcoin is in consolidation within the confines of a symmetrical triangle, awaiting a breakout to $50,000.
- Ethereum rises to a new record high as predictions point to a spike to $2,000 in the short term.
- Ripple is pivotal at $0.3 after hitting a barrier at the 200 SMA on the 4-hour chart.

The cryptocurrency market has incurred some losses, with the total market value sliding from $1.07 billion to $1.02 billion. Bitcoin dominance holds at 65%, following a drop from levels close to 70%. In other words, altcoins are continuing to outperform the largest digital asset, mainly supported by Ethereum’s rise to a new record high of around $1,446.
Bitcoin molds the technical picture breakout to $50,000
Bitcoin is yet to hit a market top, as we discussed earlier in the day. Investors in the market are optimistic that the flagship crypto will resume the uptrend and make way above the recent record high at $42,000.
The 4-hour chart brings to light the formation of a two-week symmetrical triangle pattern. The pattern is arrived at by drawing two trendlines connecting the asset’s lower highs and higher lows. These trendlines meet at a point referred to as an apex.
A breakout is expected before the lines converge. It has a precise target measured from the highest and lowest points of the triangle. The distance between the points is then added to the breakout point, which would currently target $50,000.
To validate this uptrend, Bitcoin must recover the lost ground above the 50 Simple Moving Average and the 100 SMA. Price action exceeding $38,000 will play a significant role in the breakout materializing.
%20-%202021-01-20T115830.283-637467329479802767.png)
BTC/USD 4-hour chart
Investors must be aware that the symmetrical triangle may result in an opposite action, ultimately leading to a breakdown eyeing $20,000. Therefore, it is essential to wait for the confirmation of the breakout. If the latter doesn't materialize, massive losses will come into the picture leading to levels under $34,000 and $30,000, respectively.
Ethereum hunts for a higher support
The pioneer altcoin has retread from the new all-time high in search of a higher low. The support at the ascending channel’s middle boundary has already been broken, leaving Ether with the lower edge anchorage of around $1,300.
To keep the uptrend sustained, Ether must stay above $1,200, as mentioned earlier, if not at $1,300. Meanwhile, the TD Sequential indicator recently presented a sell signal on the 4-hour chart. This call to sell manifested in a green nine candlestick. If validated, the pessimistic outlook could result in declines in one-to-four daily candlesticks.
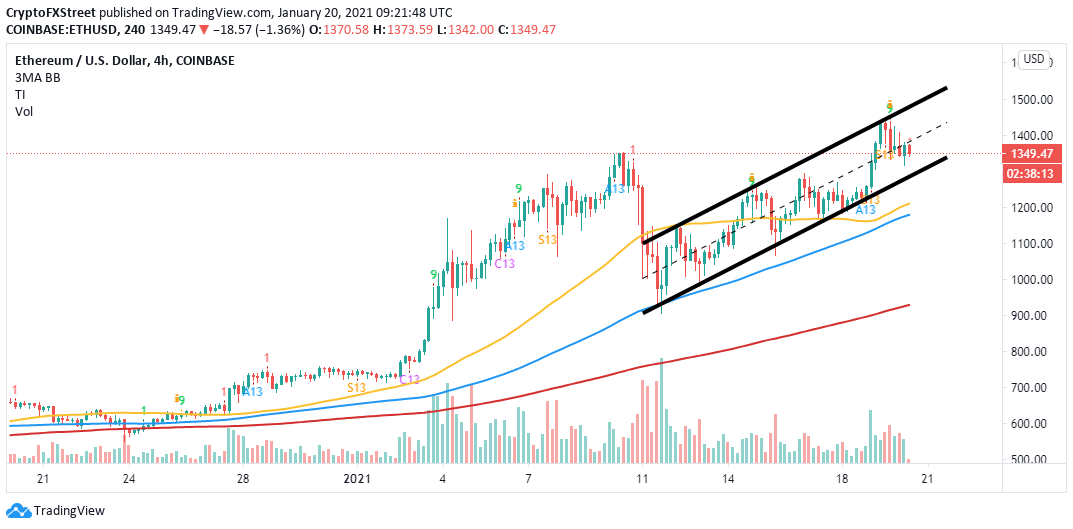
ETH/USD 4-hour chart
On the other hand, another liftoff to new all-time highs will occur if Ether closes the day above $1,400. Anticipated gains to $2,000 will be confirmed by a price action beyond $1,500 and the ascending parallel channel’s upper boundary.
Ripple out to test crucial support and resistance levels
Ripple hit price levels above $0.3, but the breakout was unsustainable. The 200 SMA on the 4-hour chart was tested but remained unshaken. A correction followed shortly after, leaving XRP pivotal at $0.3.
%20(49)-637467329597619899.png)
XRP/USD 4-hour chart
On the downside, XRP/USD is held in place by the 50 SMA, which sits slightly above the 100 SMA. The support around $0.288 remains very fundamental to Ripple’s near-term uptrend. For now, the least resistance path seems downwards, especially with the Relative Strength Index rejection from levels close to the overbought area.
Author

John Isige
FXStreet
John Isige is a seasoned cryptocurrency journalist and markets analyst committed to delivering high-quality, actionable insights tailored to traders, investors, and crypto enthusiasts. He enjoys deep dives into emerging Web3 tren



