Ethereum Classic price to collect liquidity one way or another, here's what traders should watch for
- Ethereum Classic price has risen by 38% since the start of the year.
- ETC could retest the $16 zone resulting in a 20% downswing.
- A breach above $25 would invalidate the bearish thesis.

Ethereum Classic price has cultivated a new narrative as the bulls produced a massive 25% influx on January 4. The upswing was the largest daily gainer for ETC since July 16's 31% rise, bringing a feeling of bullish nostalgia back into the market sentiment.
Ethereum Classic price takes the market by surprise
Ethereum Classic price currently auctions at $20.16. The recent surge has halted just beneath October's broken support zone, which aided a 20% rally between October 21 and November 6. From a classical technical analysis perspective, the recent uptrend hike looks like a retest into previous support. The imagery is commonly displayed before sharp sell-offs occur.
Still, calling for a bearish reversal at the top of a newly established counter trend would be ill-advised. Time is required to determine whether the ETC price is the start of a much larger move or not. If the price can remain above the 8-day exponential moving average at $19, the next bullish trade will likely retest liquidity above the current pivot level near $22. ETC will rally by 10% if the bullish scenario occurs.
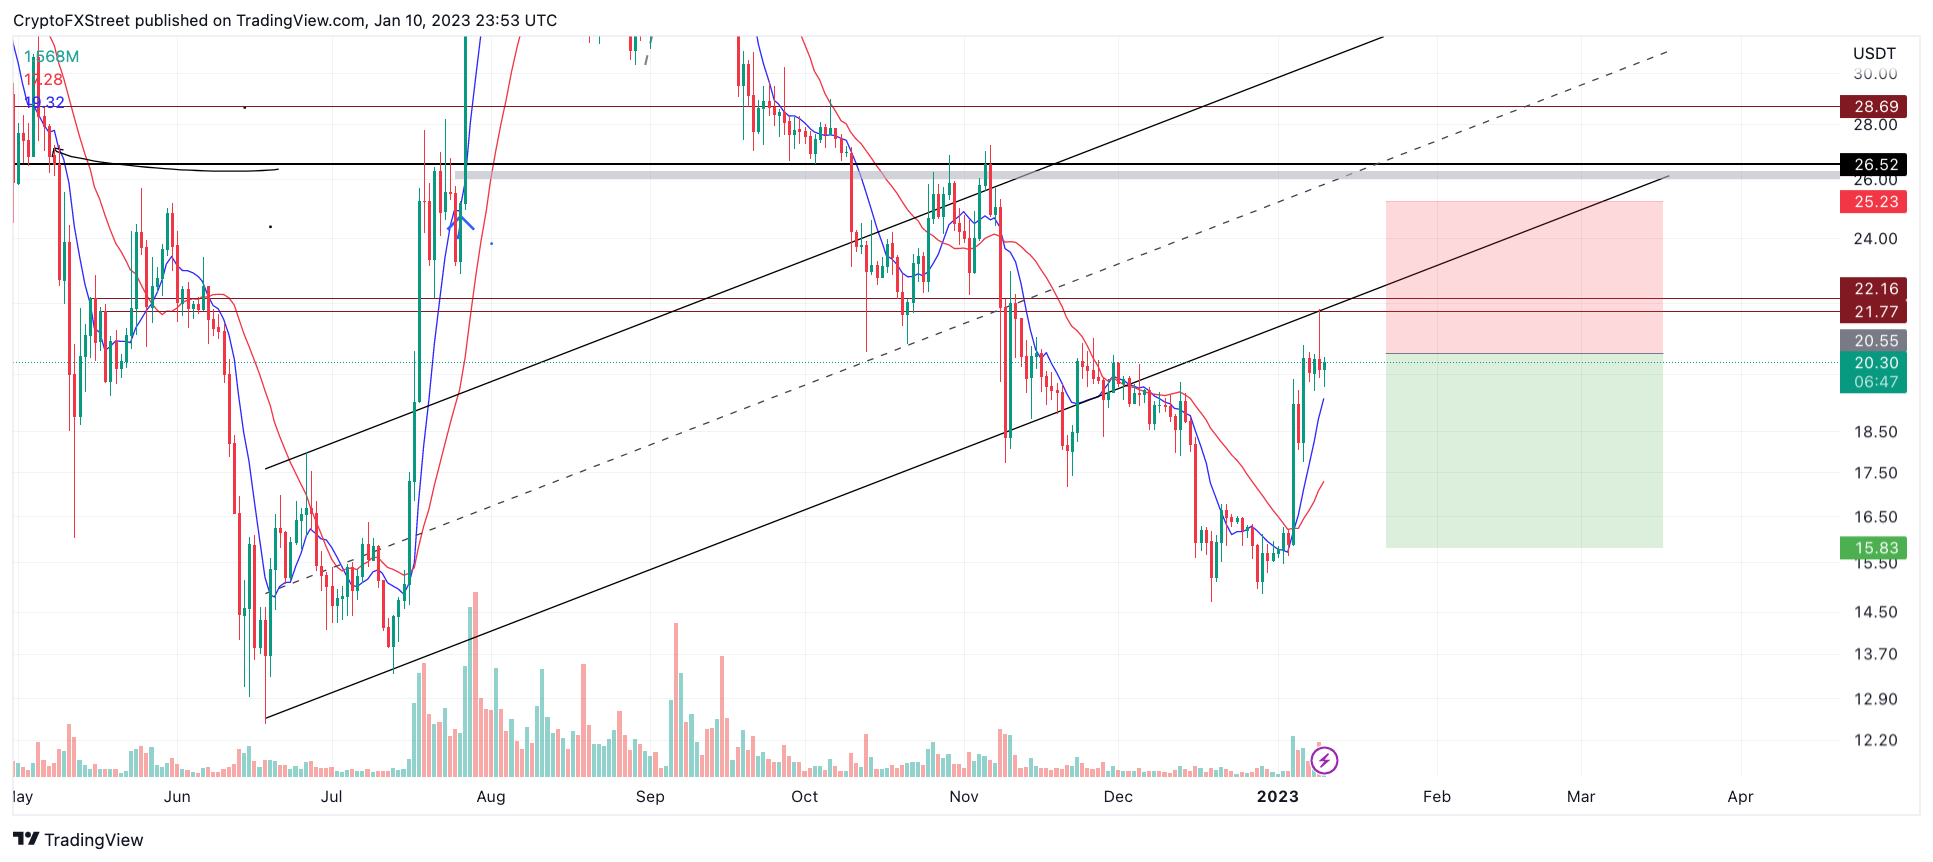
ETC/USDT 1-Day Chart
On the contrary, If the bears fail to hold support from the 8-day exponential moving average at $19, a cascade of selling could ultimately be triggered. The bears would likely challenge the $16 liquidity zone. The aforementioned price level is a vital area of liquidity that has remained untested since the initial stages of the recent 38% rally.
Invalidation of the downtrend thesis would be a breach above the $25 candlestick that tore October’s support zone. The Ethereum Classic price would increase by 20% if the bulls were successful.
This video details how Bitcoin price moves could affect Ethereum Classic price
Author

Tony M.
FXStreet Contributor
Tony Montpeirous began investing in cryptocurrencies in 2017. His trading style incorporates Elliot Wave, Auction Market Theory, Fibonacci and price action as the cornerstone of his technical analysis.



