Top 3 Price Prediction Bitcoin, Ethereum and Ripple: Weekend recovery hits pause
- Bitcoin recovery from $10,400 hit pause at $10,700, paving the way for consolidation.
- Ethereum prepares for a bullish leg towards $400 as long as the resistance between $341 and $352 is broken.
- Ripple tremendously gains ground to $0.25 after embracing support at $0.23.

Cryptocurrencies are stepping into the new week majestically, even as recovery hovers on the horizon. Trading over the weekend was mainly sluggish, especially for the major digital assets. Bitcoin held above support at $10,400 and Ethereum $335. On the other hand, Ripple built on support established at $0.23 and pulled closer to $0.25.
Altcoins, especially those in the decentralized finance (DeFi) sector, continued to bleed as highlighted by the week's top 3 losers. The market is mixed red and green with Ripple and Yearn.finance (YFI) among the most improved over the last 24 hours.
Bitcoin bulls regaining control over the price
Bitcoin price spiraled under $10,500 twice last week. The initial drop occurred after the flagship cryptocurrency reacted to BitMEX exchange charges by the US Commodities Futures Trading Commission (CFTC) for violating the Banking Secrecy Act and selling unregistered derivatives in the region. On Friday, the second dump saw Bitcoin react negatively to the news that Donald Trump tested positive for COVID-19.
The pioneer cryptocurrency, however, resumed the uptrend despite lethargic price action over the weekend. BTC/USD stepped above $10,700 during the Asian session on Monday, before dropping to the current market value of $10,685. Bitcoin's immediate upside is capped by the 50 Simple Moving Average (SMA).
BTC/USD 4-hour chart
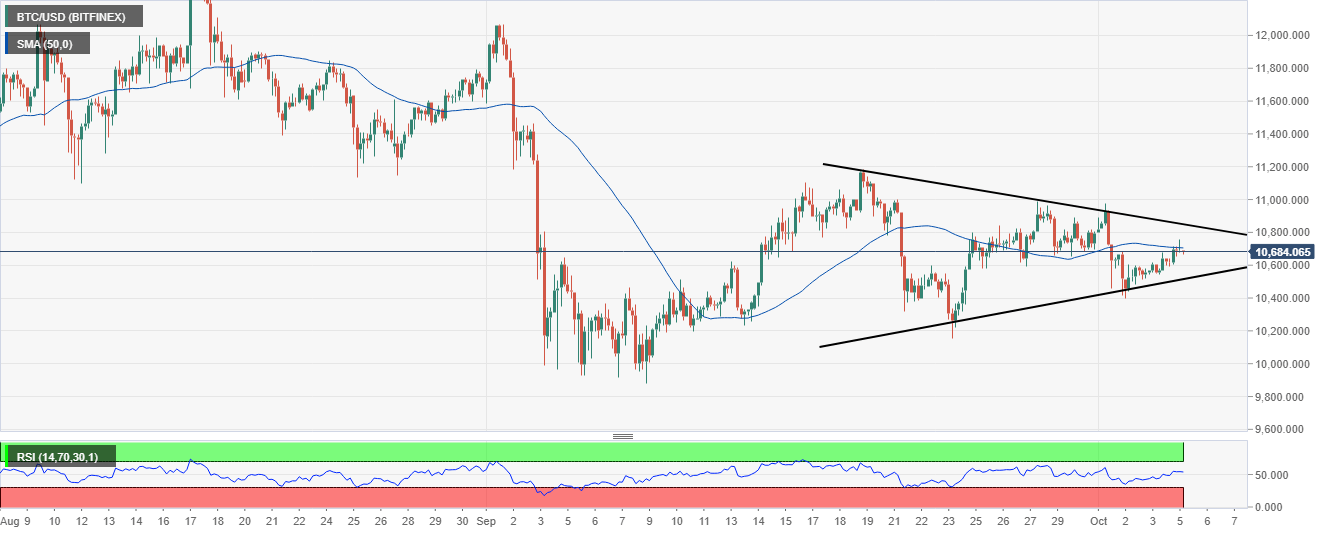
The flagship cryptocurrency is trading within a symmetrical triangle at the time of writing. The Relative Strength Index (RSI) also climbed above the midline but appeared to be settling for a leveling motion. In other words, recovery may hit pause, giving way for consolidation in the coming sessions. It also means that the expected triangle breakout may be delayed.
IntoTheBlock's IOMAP model brings into light the possibility of BTC staying in consolidation in the coming sessions, especially on Monday. A glance towards $11,000 reveals stacks of resistance zones—the most prominent one running from $10,670 to $10,980. Here, nearly 1.6 million addresses bought roughly 850,000 BTC.
BTC/USD IOMAP chart
-637374758879306270.png)
On the downside, the pioneer cryptocurrency is seating on an area with an immense concentration of buyers. The region extends to $9,000, but the most robust support lies between $10,351 and $10,660. Here, nearly 1.6 million addresses previously purchased approximately 1.2 million BTC.
Ethereum recovers within an ascending parallel channel
Ethereum's recent breakdown from levels above $360 found support at $335. For a brief moment, bulls took back control and pulled the smart contract token above $350. Although they had eyes fixated to reclaiming the lost ground above $360, gains were capped under the confluence formed by the 50 SMA and 100 SMA. Ether is doddering at $351 at the time of writing amid a gradually building bullish momentum.
ETH/USD 4-hour chart
 - 2020-10-05T080939.110-637374759392642652.png)
The Moving Average Convergence Divergence (MACD) confirms the bulls' push to regain control as it nears the midline. A bullish divergence from the MACD emphasizes the growing bullish grip. On the downside, support is envisaged at the channel's lower boundary, $340, $335 and $320.
IntoTheBlock's IOMAP model confirms the bullish narrative by revealing the reducing resistance towards $400. However, the hurdle between $353 and $363 must come out of the way for gains to $400 materialize. Here, roughly 790,000 addresses bought nearly 5.3 million Ether. On the downside, the smart contract token is holding above an area of immense support, starting from $341 to $352. Here, approximately 654,000 addresses previously purchased 11.2 million ETH. It is unlikely that Ethereum will dive below this zone in the near term. Nonetheless, if it does, declines could extend to $320.
Ethereum IOMAP chart
-637374760263170443.png)
Ripple leads in recovery as $0.3 beckons
The fourth-largest cryptocurrency has made a significant recovery from September's support at $0.22. Last week, the uptrend was dented by a bearish wave that swept across the cryptocurrency market. XRP embraced support at $0.23 before resuming the uptrend. Over the last 24 hours, the cross-border token has step above a descending parallel channel, closing in on $0.25. However, the immediate upside is limited by the 50-day SMA. If the moving average flips into support, XRP could continue with the price action towards $0.3. On the downside, the 100-day SMA is in line to offer support in addition to $0.23 and $0.22.
XRP/USD daily chart
 (71)-637374761011987702.png)
Santiment's holder distribution metric shows the spike in XRP price is due to the buying spree among the whales. For instance, addresses holding between 100,000 and 1 million XRP have been on a consistent rise in the last 30 days. Although the addresses with coins between 1 million and ten million dropped on September 26, they have significantly grown in the past few days to 1,340. If this buying pressure continues, the path to $0.3 would be easy to navigate.
Ripple holder distribution chart
 [08.53.56, 05 Oct, 2020]-637374762028810423.png)
Daily takeaway
Bitcoin price recovers from the support at $10,400 but stalls marginally above $10,700. Consolidation is likely to take precedence based on IntoTheBlock's IOMAP model.
Ethereum embraced support at $335 following last week's declines. A reversal that commenced over the weekend is holding above $350. Ether is trading above an area of immense support. However, the resistance between $341 and $352 must come down for gains to $400 to come into the picture.
Ripple continues to lead the recovery in the market after bouncing off support at $0.23. The resistance at $0.25 is holding the price from pulling towards $0.3. However, if the whales' buying pressure continues to increase, then action to $0.30 will be supported.
Author

John Isige
FXStreet
John Isige is a seasoned cryptocurrency journalist and markets analyst committed to delivering high-quality, actionable insights tailored to traders, investors, and crypto enthusiasts. He enjoys deep dives into emerging Web3 tren



