Top 3 Prediction Bitcoin, Ethereum, Ripple: ETH soars above $4,000, as BTC and XRP struggle
- Bitcoin price beginning to hint at a complex topping process.
- Ethereum price shakes off rising wedge pattern to test new Fibonacci extension level.
- XRP price needs a big day to overcome to void trading rule.

Bitcoin price lack of impulsiveness and commitment speaks of a corrective rally. Ethereum price turbocharged over the weekend, nearing a significant milestone. XRP price sinks into indecision as faith in a continuation of the rally weakens.
Indicator warning of froth in the cryptocurrency market
Tremendous rallies for several cryptocurrencies such as Binance Coin, Ethereum, Cardano and Dogecoin have captivated all investors’ attention, not just the altcoin-focused traders. The performance has far exceeded the gains in Bitcoin and increased speculation that the ‘froth’ in the space has raised the probability for a day of reckoning for the space soon.
At the forefront of the pessimistic view and arguments of froth is a crucial statistic, Bitcoin’s share of the $2.6 trillion cryptocurrency market. It has declined from a peak of 70% to less than 45% since the start of 2021. More specifically, it demonstrates the notable retail demand behind the surge in altcoins, at least according to institutional strategists.
Bitcoin market capitalization percentage
Central banks heightened stimulus has promoted increased demand for cryptocurrencies, particularly in light of the dwindling options for superior alpha-producing opportunities in the more traditional investments, such as fixed income or equities.
Nevertheless, it is easier to dismiss the compelling climb in altcoins due to historical levels of stimulus or unrefined investing by retail traders. Some credit needs to go to the cryptocurrency space as a wave of projects elevates blockchain technology into the lives of everyday people.
Bitcoin price tests patience with upward churn
The breakout from an inverse head-and-shoulders pattern on April 30 has not resulted in a compelling rally continuation. Instead, it has been marked by sluggish price action with a slight upward bias. To be exact, Bitcoin price has rallied about 20% from the April low and just 2% from the inverse head-and-shoulders breakout.
The lack of impulsiveness and inability to detach from the 50-day simple moving average (SMA) is more consistent with a corrective rally, lacking institutional commitment. From a broader interpretation, the rounding pattern on the daily chart since the February high is beginning to look more like a complex topping process rather than a reset or corrective process.
Bitcoin price is on the cusp of a minor trend change as the rising trend line from the April low runs directly through the 50-day SMA at $56,756, just $600 below the current price. A daily close below the support level would project a quick decline to the May 5 low at $53,000 and potentially the right shoulder low at $52,369, which would invalidate the mildly bullish working thesis.
The next support is the April low at $47,044, and if the situation deteriorates, Bitcoin price should test the February low at $43,016.
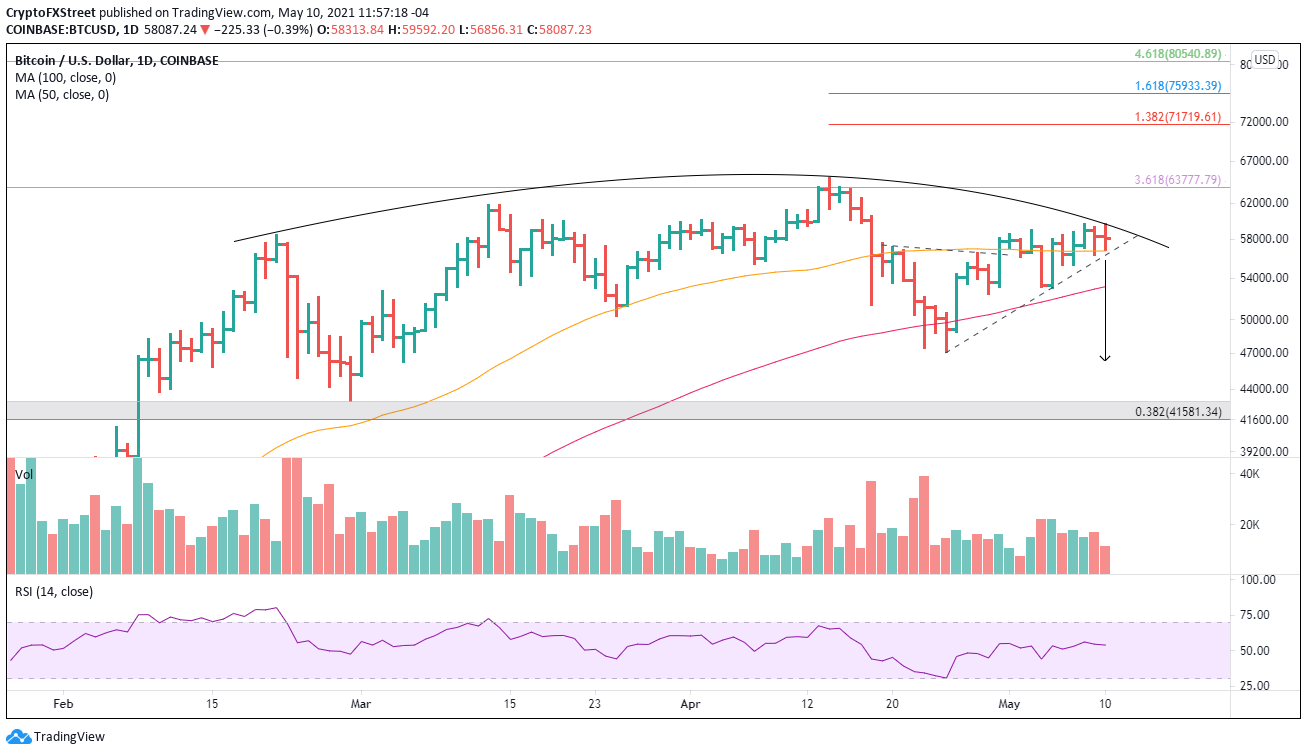
BTC/USD daily chart
A renewal of the rally from the April low will find notable resistance at the 361.8% Fibonacci extension of the 2017-2018 bear market at $63,777, a level that arrested the attempt at new highs in mid-April.
If Bitcoin price succeeds in overcoming the Fibonacci resistance mentioned above, it should generate a rally to the 138.2% extension of the April correction at $71,719 and then the 161.8% extension of $75,933. Beyond that is the 461.8% extension of the 2017-2018 bear market at $80,540.
Ethereum price reaches new milestone
On May 8, ETH voided the rising wedge thesis with an explosive gain of 12.41% gain, lifting the 6-week return to 132% and nearly equaling the performance levels printed in January and February.
It took Ethereum price 72 days to rally from $2,000 to $3,000 and only seven days to rally from $3,000 to $4,000. Speaks to the impulsiveness of the rally over the last couple of weeks.
Currently, Ethereum price is only $200 away from the 361.8% Fibonacci extension of the April correction at $4,232, and bigger aspirations for ETH could target the 361.8% extension of the 2017-2018 bear market at $4,926.
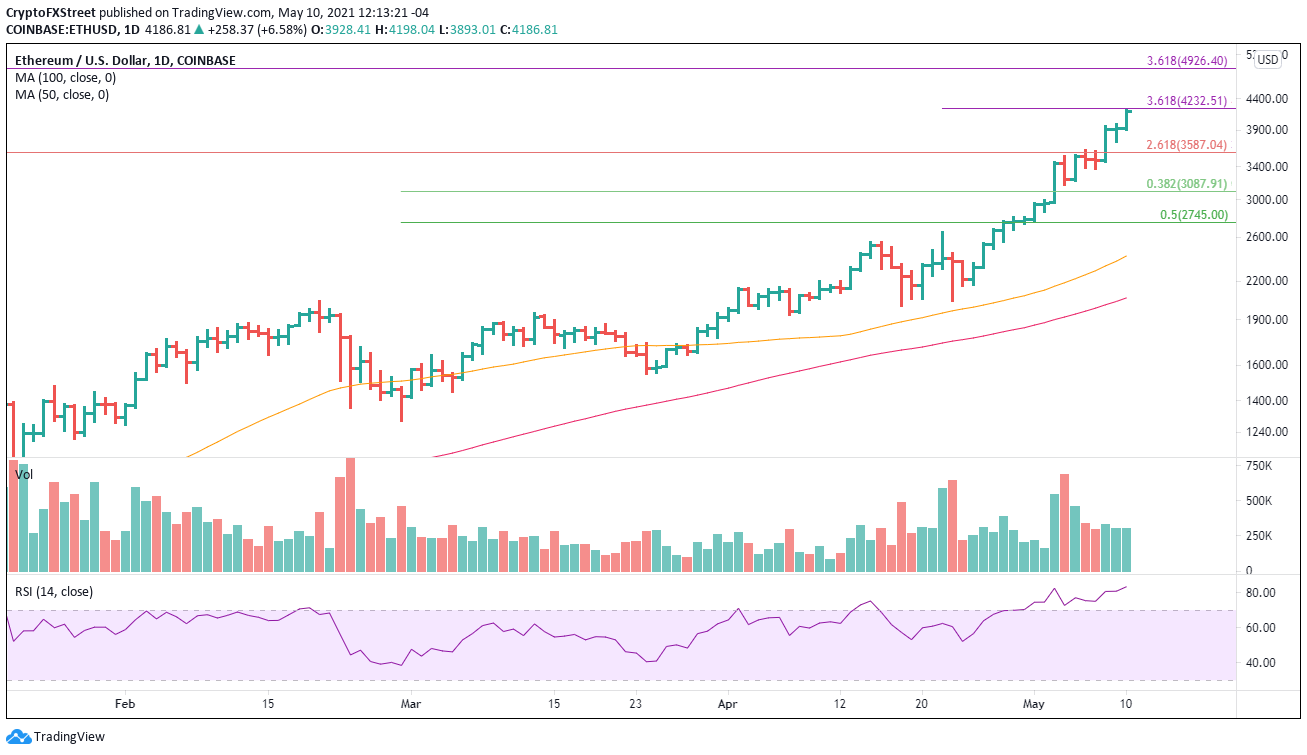
ETH/USD daily chart
Essential support begins at the 261.8% extension of the 2017-2018 bear market at $3,587, followed by the 38.2% retracement of the rally from the February low at $3,087.
XRP price at a critical point in the rally
It has been four days since XRP price broke out from a cup-with-handle base before reversing by the close of trading. The reversal triggered the pullback-plus-four rule that specifically states that if a breakout reverses back into the base, you give it four days to trade above the breakout day high. A failure to do so increases the probability that XRP price is ready to decline or even embark on a more complex pattern.
For now, the Ripple bullish outlook is active, but it is time to manage the thesis with caution. The first resistance is the May 6 high at $1.76 and then the confluence of the April high at $1.96, the psychologically important $2.00 and the 61.8% Fibonacci retracement of the 2018-2020 bear market at $2.08.
The measured move target of the cup-with-handle base is $3.16, yielding a 90% gain from the handle high at $1.66. A rally of that degree would put XRP price within reach of the 2018 high of $3.30.
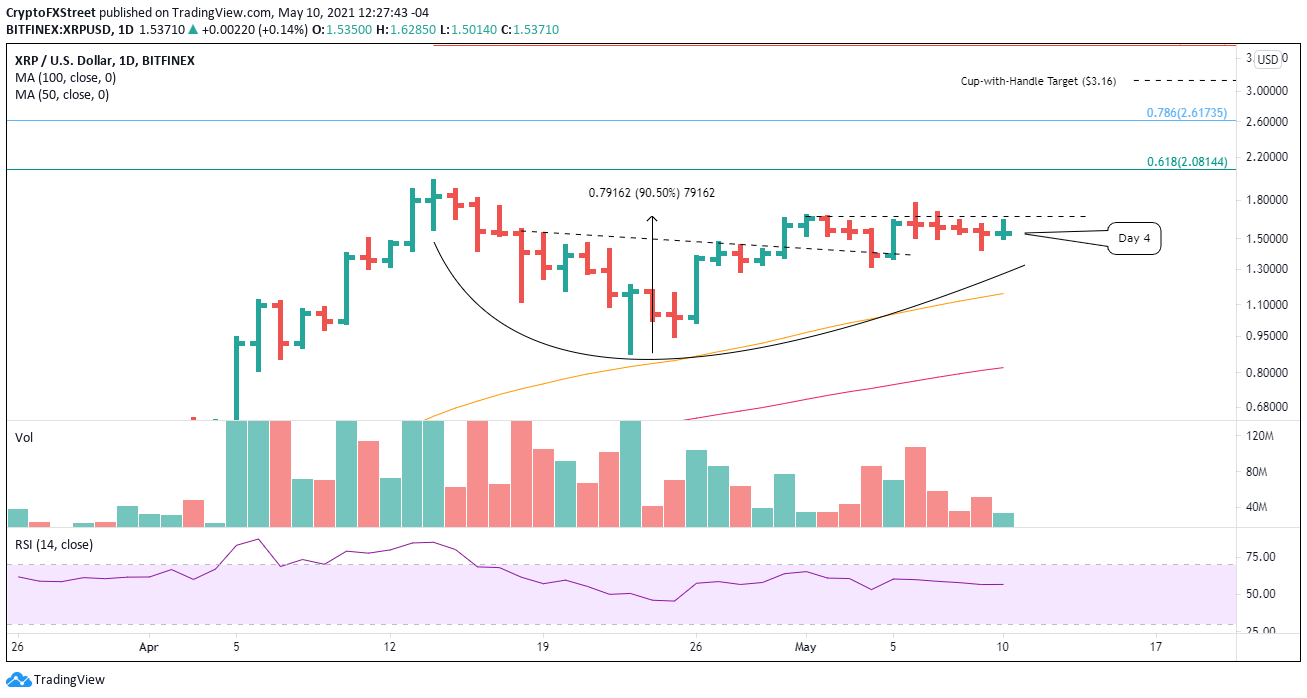
XRP/USD daily chart
A failure to overcome the May 6 high at $1.76 today should put traders on the defensive and prompt at least a reduction in positions. A decline below the handle low of $1.31 would suggest that XRP price is carving out a more complex bottom or vulnerable to a monster decline.
Author

Sheldon McIntyre, CMT
Independent Analyst
Sheldon has 24 years of investment experience holding various positions in companies based in the United States and Chile. His core competencies include BRIC and G-10 equity markets, swing and position trading and technical analysis.


