Toncoin price looks poised for 24% rally
- Toncoin price breaks out of a cup and handle pattern, a bullish sign.
- On-chain data suggests growing activity and interest within the TON’s ecosystem.
- A daily candlestick close below $6.01 would invalidate the bullish thesis.

Toncoin (TON) price breaks out of a cup and handle pattern, a bullish continuation configuration. On-chain data indicates a surge in TON's growing activity and interest could propel prices to surge by 24%.
Toncoin price forms bullish technical pattern
Toncoin price closed above the resistance level of the Cup and Handle pattern at $7.70 on Thursday, which signifies a bullish breakthrough. This pattern, crafted by TON's price movements from mid-April to early June, delineates a U-shaped bottom formation, termed the cup, followed by a smaller U-shaped bottom known as the handle.
This breakout of a bullish continuation pattern forecasts a 41% rally to $10.86, obtained by adding the depth of the cup to the breakout point.
Considering the current market conditions, this outlook is extremely bullish and is unlikely to be achieved. Investors can remain conservative and start booking profits around the 161.8% Fibonacci extension level at $9.61, drawn from a swing high of $7.70 on April 13 to a swing low of $4.60 on May 1. This move would constitute a 24% gain.
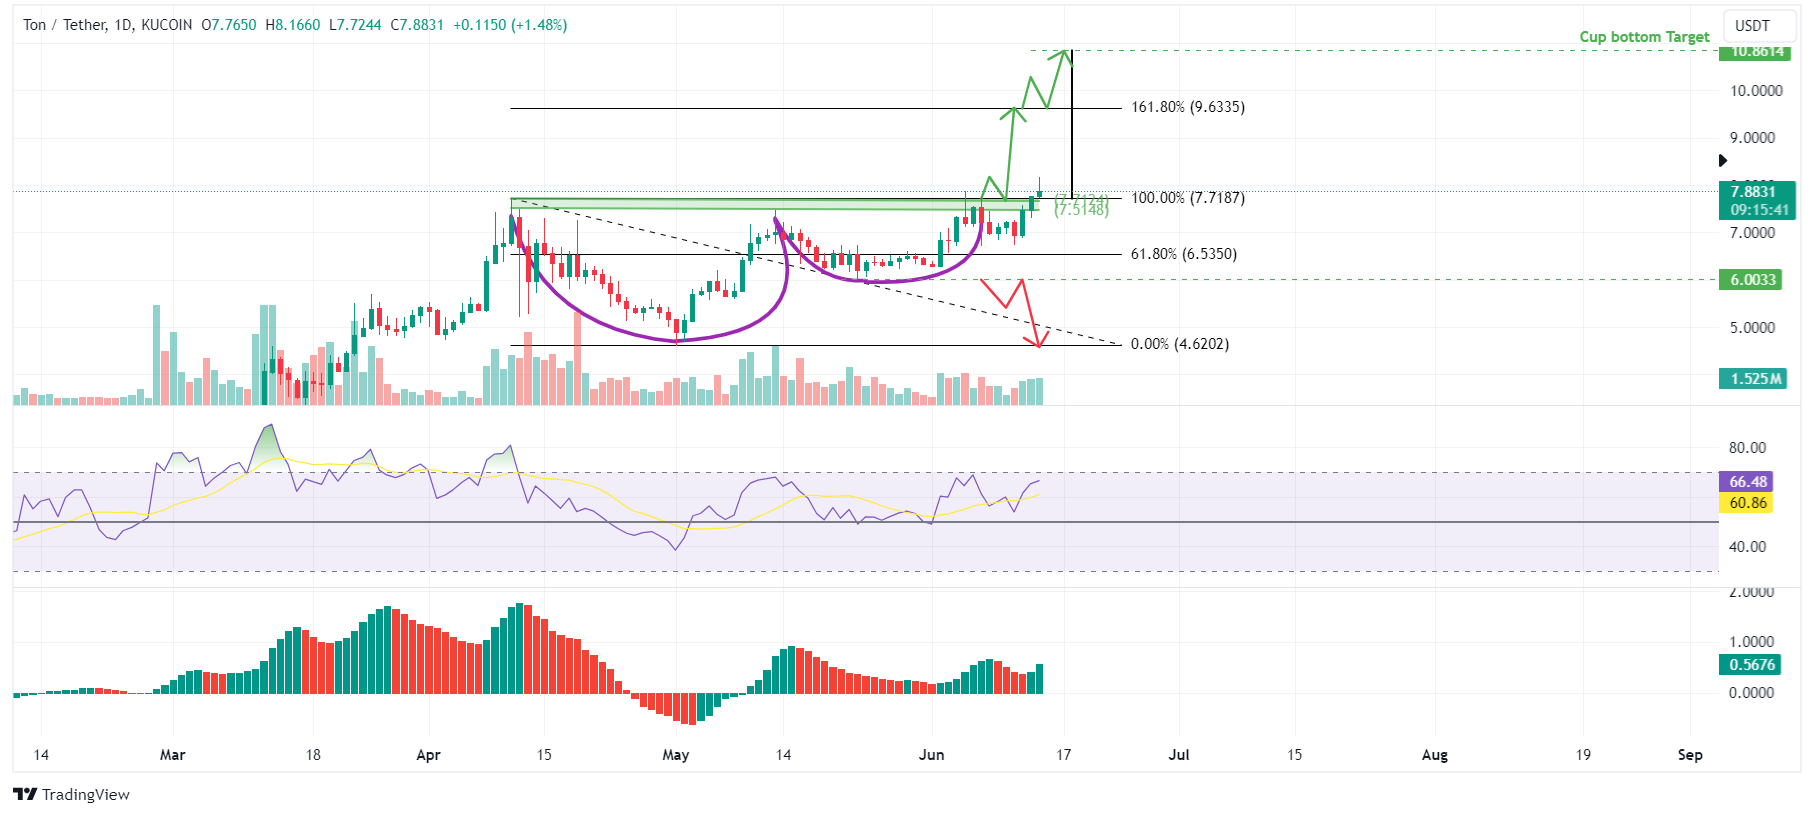
TON/USDT 1-day chart
Additionally, crypto intelligence tracker DefiLlama data shows that TON’s Total Value Locked (TVL) has increased from $420.47 million on June 8 to an all-time high of $569.45 million on June 14.
This 35% increase in TVL indicates growing activity and interest within the TON ecosystem. It suggests that more users are depositing or utilizing assets within TON-based protocols, adding further credence to the bullish outlook.
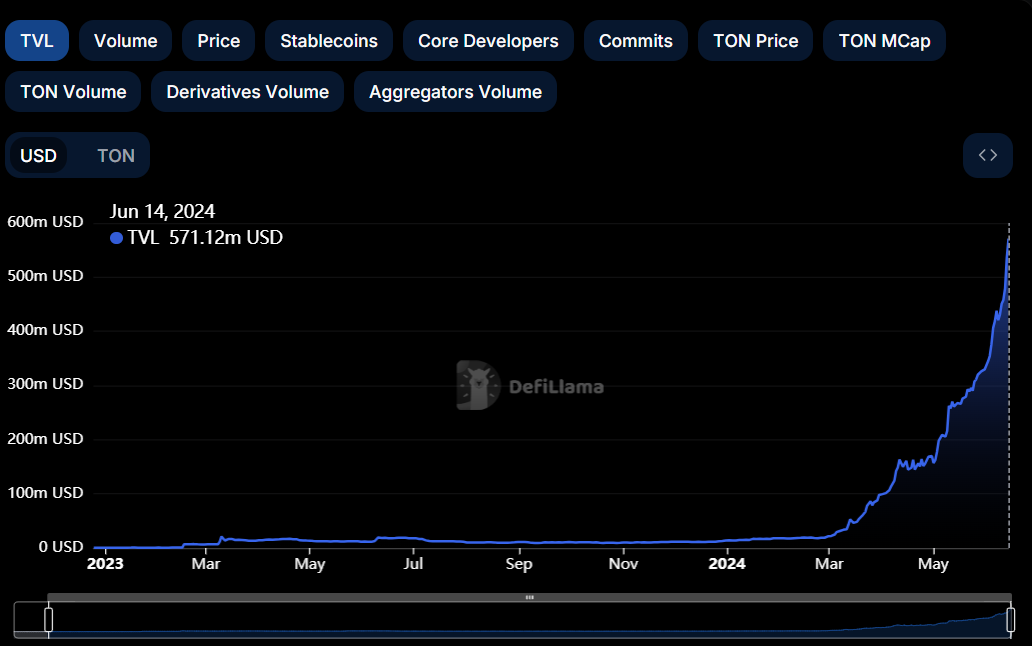
TON TVL chart
Even though the on-chain metric and technical analysis point to a bullish outlook, if TON’s produces a daily candlestick close below $6.01, the daily support level, the move would invalidate the bullish thesis by producing a lower low on the daily time frame. This development could see Toncoin's price fall 23% to the weekly support level of $4.60.
Author

Manish Chhetri
FXStreet
Manish Chhetri is a crypto specialist with over four years of experience in the cryptocurrency industry.



