Three reasons why SafeMoon price will decline to $0.00000110
- SafeMoon price reverses the August 7 spike of 30.59%, relinquishing the upper trend line of the descending triangle pattern.
- SAFEMOON is trading again below major resistance associated with the May 19 low of $0.00000261.
- SafeMoon’s unusual structure of charging a 10% fee to buy and another 10% to sell is a disincentive for speculators.

Safemoon price fails to hold the largest one-day gain since the May 6 rally of 59.79%, while declining back below the upper trend line of the descending triangle, the May 19 low of $0.00000261 and the 20-day simple moving average (SMA) at $0.00000252. The short-lived rally reflects an outlier cryptocurrency with a questionable fee structure that frequently hypes a SafeMoon Wallet before extending the launch date, now on August 28th, 2021.
SafeMoon fee structure raises a big red flag
In the beginning, SafeMoon distinguished itself with a massive return of more than 19,000%, putting it on the map of social media coverage and establishing it as another beneficiary of the FOMO condition that drove meme tokens in 2021.
However, further investigation into the SafeMoon fee structure revealed a 10% fee to buy tokens and another 10% to sell. Half of the paid fees are directly paid to current owners of SAFEMOON as motivation to keep holding the digital asset, and the other half is funneled to a liquidity pool that the developers direct.
The fee structure raises a red flag for most accomplished investors. In particular, the mechanism to curtail selling opens SAFEMOON up to manipulation risk.
The unique but questionable fee structure leaves many questions and detracts from the authenticity of SAFEMOON in the cryptocurrency market. Moreover, it is a disincentive for short-term retail speculators trading over shorter periods, who are often the buying pressure behind notable moves in meme tokens. As a result, the SafeMoon price action has reflected the lack of an impulsive retail bid. There is a strong probability that the reason is motivated by the complex fee structure.
SafeMoon Wallet launch has still not happened
SafeMoon has been hyping the new SafeMoon Wallet for several months, but it has been met with delays. During this Sunday’s twitch stream, the executives confirmed that the Wallet launch would be on August 28th, 2021 and emphasized their intentions “to do things the right way” and how that impacted the timing of the release.
According to the website, the SafeMoon Wallet is a “secure place to store and trade your SafeMoon.” Some key features include Simplex integration, dark mode, contacts list, hold to cancel, and haptic feedback.
Also, during the Sunday Twitch stream, the executives announced many updates and products in the pipeline for 2021, probably with the hope of boosting SafeMoon price. The roadmap includes version 2 of SafeMoon coming in September, the launch of the SafeMoon exchange in October, which seeks to host 3,000 transactions simultaneously, the launch of the SafeMoon podcast in November and the SafeMoon blockchain in December.
✨ #SAFEMOON KEY MOMENTS pic.twitter.com/2aUQXrWKES
— SafeMoon (@safemoon) August 8, 2021
Nevertheless, until SafeMoon officially launches the Wallet, there will be an overhang of skepticism about the potential for a real-world purpose and advantage in the increasingly competitive cryptocurrency space. Based on the recent SafeMoon price action, doubts about transforming from a token with no utility to a token with real-world use remain ever-present. For now, SAFEMOON will need to rely on the popularity struck through the impressive gains earlier in the year to continue the story.
SafeMoon price experiences a technical event, not a new trend
On July 28, SafeMoon price recorded a daily close below the horizontal line of the descending triangle, anchored to the May 19 low of $0.00000261. Despite multiple reactions, it was the first daily close below the level, followed by a decline to $0.00000190 on August 2. The SAFEMOON drop from the July 24 swing high of $0.00000310 created an oversold condition on the daily Relative Strength Index (RSI) and led to sideways price action.
It is clear from the SafeMoon price action over the last three days that the burst higher on August 7 was a technical event generated by the oversold condition and contracting SAFEMOON price conditions following the August 2 low.
The quick reversal has knocked SafeMoon price below the May 19 low of $0.00000261 and the imposing 20-day SMA at $0.00000251. The moving average had been resistance since June 19.
A failure to maintain the SafeMoon price close above the May 19 low, the 20-day SMA and the descending triangle’s upper trend line indicated that SAFEMOON is not ready to pursue higher prices or confirm a trend change.
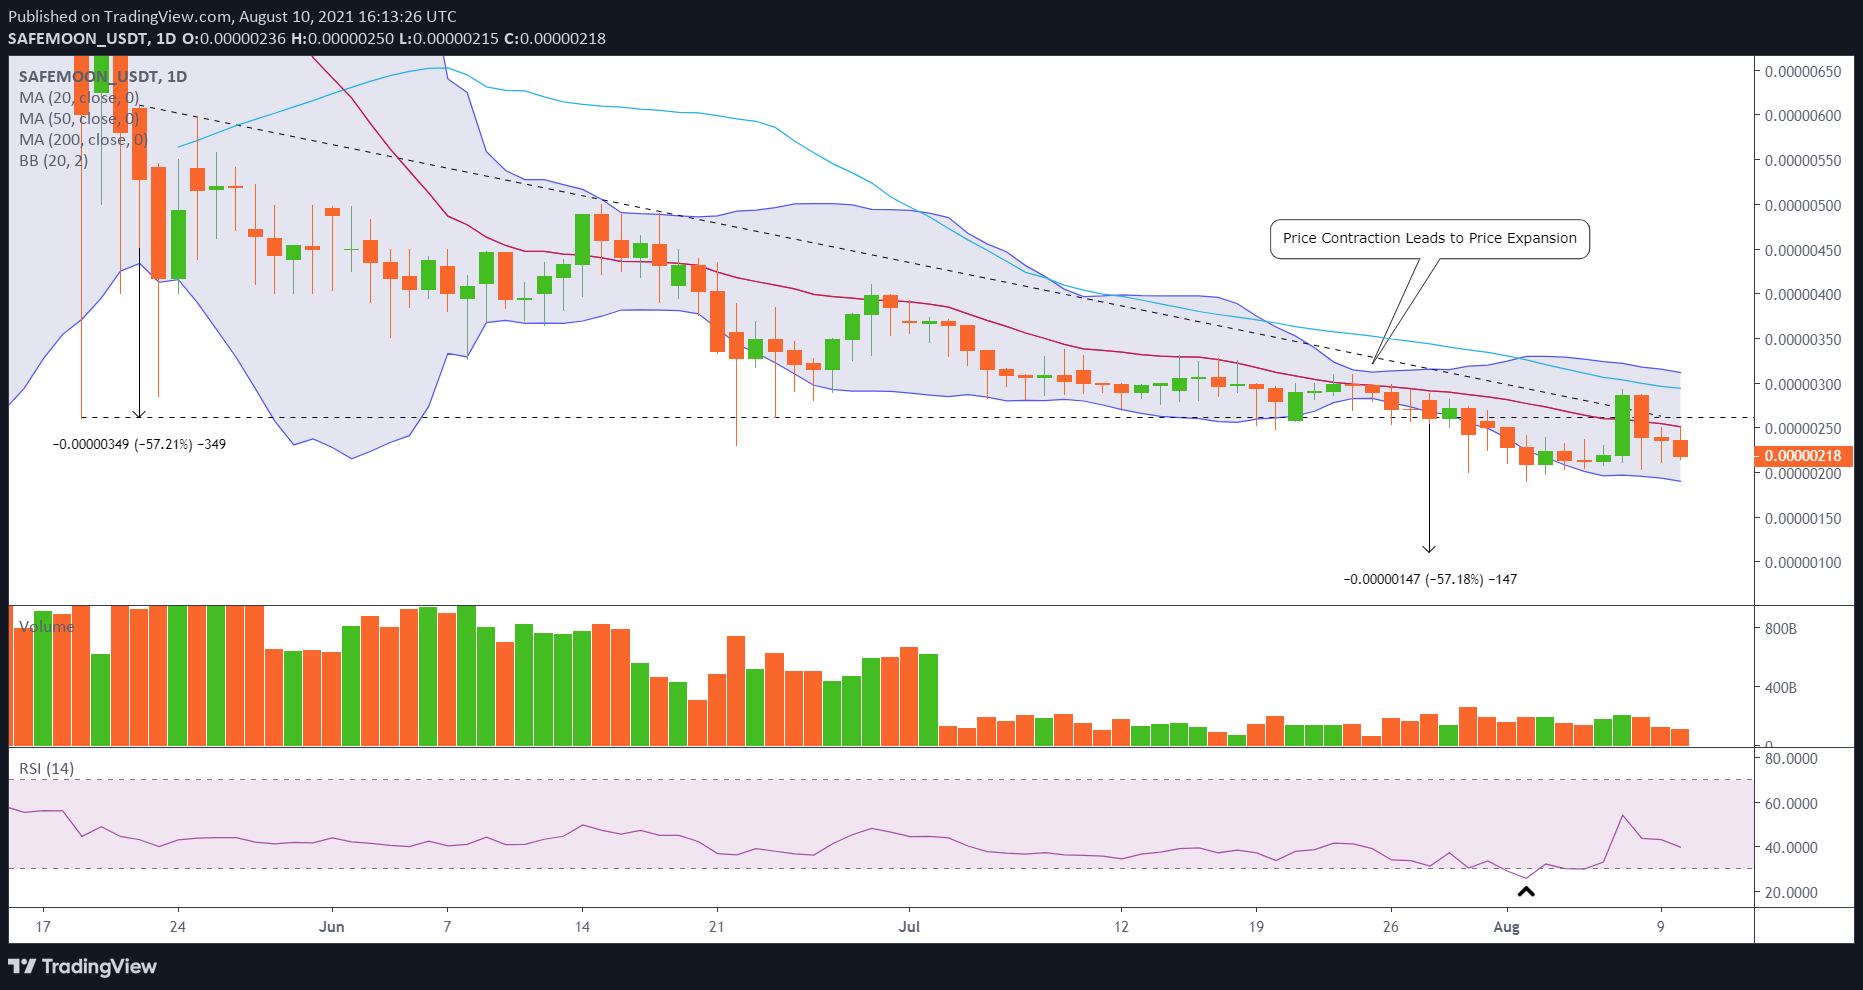
SAFEMOON/USD daily chart
To begin a break from the bearish SAFEMOON price structure and a reassessment of the narrative, SafeMoon price needs to register a daily close above the 50-day SMA, currently at $0.00000294.
SAFEMOON has become a popular cryptocurrency, and the traffic related to FXStreet posts on SafeMoon confirms it. Nevertheless, the convergence of a questionable and risky fee framework with delays in the SafeMoon Wallet launch and the unsettled SafeMoon price structure projects bearish outcomes for the meme token in the weeks ahead, including a potential test of the descending triangle’s measured move target of $0.00000110.
Here, FXStreet's analysts evaluate where SafeMoon could be heading next as seems to be breaking out.
Author

Sheldon McIntyre, CMT
Independent Analyst
Sheldon has 24 years of investment experience holding various positions in companies based in the United States and Chile. His core competencies include BRIC and G-10 equity markets, swing and position trading and technical analysis.




