SafeMoon price awaits 50% drop as interest in SAFEMOON evaporates
- SafeMoon price has unraveled a bearish outlook given by the governing descending triangle chart pattern.
- SAFEMOON could be at risk of a 50% plunge should it fall below $0.00000187.
- However, a close above $0.00000255 could see the reversal of fortune materialize.

SafeMoon price has formed a bearish chart pattern that suggests the token is headed for a big move to the downside. The diminishing volume has not worked in favor of the bulls, and a lower low for SAFEMOON could signal a 50% drop.
SafeMoon price paints bearish outlook
SafeMoon price appears to be trading within a descending triangle pattern, presenting an outlook geared for a move lower. The lackluster trading volume adds credence to the bearish outlook, as SAFEMOON has seen diminished interest.
The governing technical pattern suggests that SafeMoon price could be heading for a 57% decline measured from the base of the triangle, targeting $0.00000108 as SAFEMOON has already sliced below the lower trend line of the chart pattern. This would be a 50% move to the downside from the current price.
Moving forward, SafeMoon price may see a retest of support at the swing low at $0.00000187 before the aforementioned target materializes. The creation of a lower low could confirm that SAFEMOON is at risk of a hefty decline.
SafeMoon price appears to have scarce support, but given that the trading volume has subsided, the token could be saved if selling pressure does not increase. A spike in selling pressure could push SAFEMOON lower toward the 127.2% Fibonacci retracement level at $0.00000077.
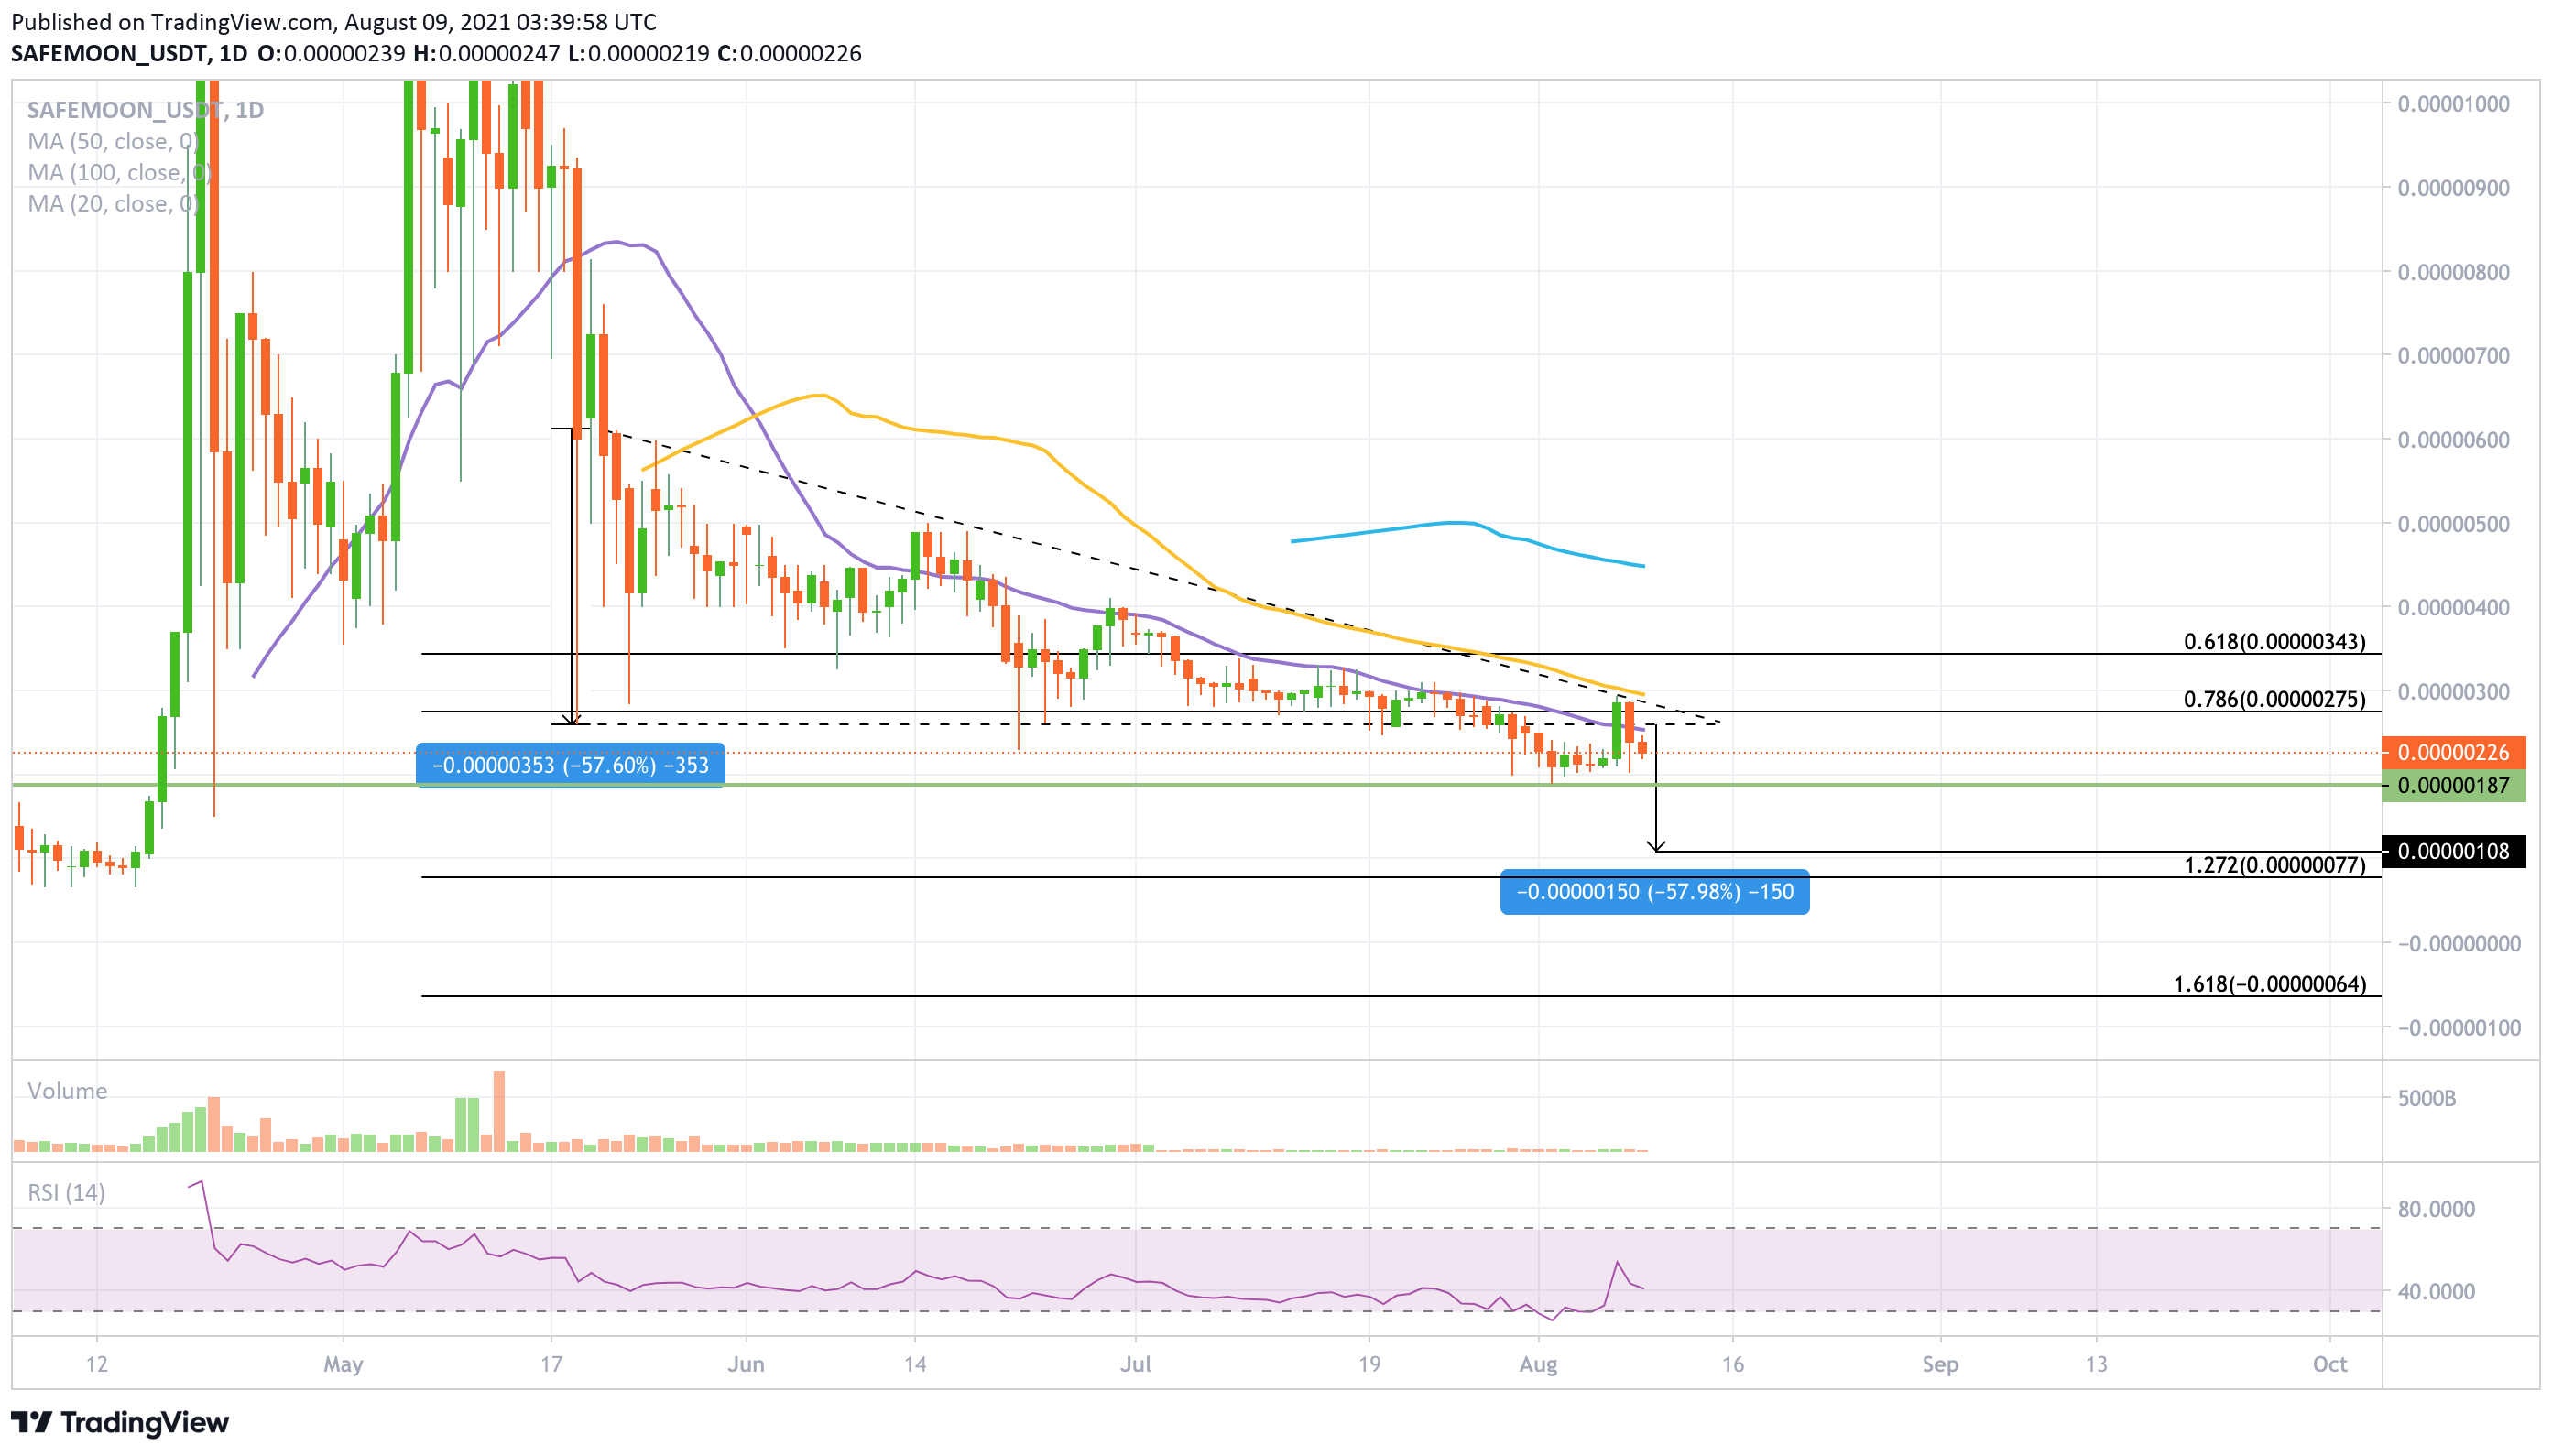
SAFEMOON/USDT daily chart
Chances for SafeMoon price to witness a reversal of fortune is minimal, as the first resistance is seen at the 20-day Simple Moving Average (SMA) at $0.00000255, coinciding with the horizontal trend line given by the descending triangle pattern.
Further hurdles are seen not very far from the first obstacle, given by the 78.6% Fibonacci retracement level at $0.00000275, before the next resistance at the diagonal trend line, which meets the 50-day SMA at $0.00000292.
SafeMoon price could continue to move to the downside as it consolidates unless the bulls step in. For now, buyers are nowhere to be found, suggesting that SAFEMOON could see its price action muted in the near term.
Author

Sarah Tran
Independent Analyst
Sarah has closely followed the growth of blockchain technology and its adoption since 2016.