SafeMoon Price Forecast: SAFEMOON ignores wallet hype, primed for lower prices
- SafeMoon price breaks May 19 low, triggers descending triangle and proceeds to fall 27%.
- SAFEMOON daily Relative Strength Index (RSI) did mark an oversold condition at the August 2 low, but no rebound has materialized, supporting forecasts for lower prices.
- SafeMoon waiting for the beta launch of the Android-specific mobile wallet on August 7.

SafeMoon price break down from a descending triangle pattern on July 28 finally resolved a period of trendless, coiling action. The breakdown was preceded by a notable compression in the Bollinger Bands towards the latter part of July and an inability to gain traction above the robust 20-day simple moving average (SMA). As a result, SAFEMOON dropped below the May 19 low and fell 27%. The sideways action over the last three days is just a pause in a larger decline, even as SafeMoon aims to launch the beta version of its Android mobile wallet tomorrow.
SafeMoon developers excited about the launch, investors not so much
SafeMoon has been pursuing a program of innovation that would promote the cryptocurrency from a target of fierce speculation, as witnessed earlier this year, into a viable alternative with real-world use. Part of the program is the upcoming launch of the beta version of its Android mobile wallet, set for tomorrow, August 7. It marks the first mobile-specific product from SafeMoon developers.
It is an interesting inflection point and an exciting moment for SafeMoon developers, but market speculators have not responded with the same excitement. This week, in the run-up to the launch, SafeMoon price is down -3.5%, suggesting that the SAFEMOON speculators are not convinced that the project has reached the utility threshold.
SafeMoon price punishes the reckless investors
At the August 2 low of $0.00000190, SafeMoon price was down 27% from the descending triangle breakdown and 39% from the July 24 high of $0.00000310, pushing SAFEMOON outside the Bollinger Bands and pressing the daily RSI into an oversold condition.
The $0.00000190 low is still far from the measured move price target of $0.00000111 for the descending triangle, presenting a challenging outlook for SAFEMOON investors. A drop to the price target equates to a 49% loss from the current price.
More importantly, the consolidation over the last three days, including a doji candlestick pattern yesterday, is not the beginning of a bottom. Based on the price structure, the sideways SafeMoon price action is a pause in a more significant decline for SAFEMOON.
To achieve the measured move price target of $0.00000190, SafeMoon price will need to overcome the support embedded in the April 21 low of $0.00000150. Otherwise, SAFEMOON is free to test the target.
If SafeMoon price breaks through the measured move price target, it may fall to the April descending trend line, currently at $0.00000041, representing an 81% decline from the current price.
Fundamental to the continuation of the decline is a surge in volume accompanying the selling. So far, SAFEMOON volume has remained muted, showing no rush for the exits.
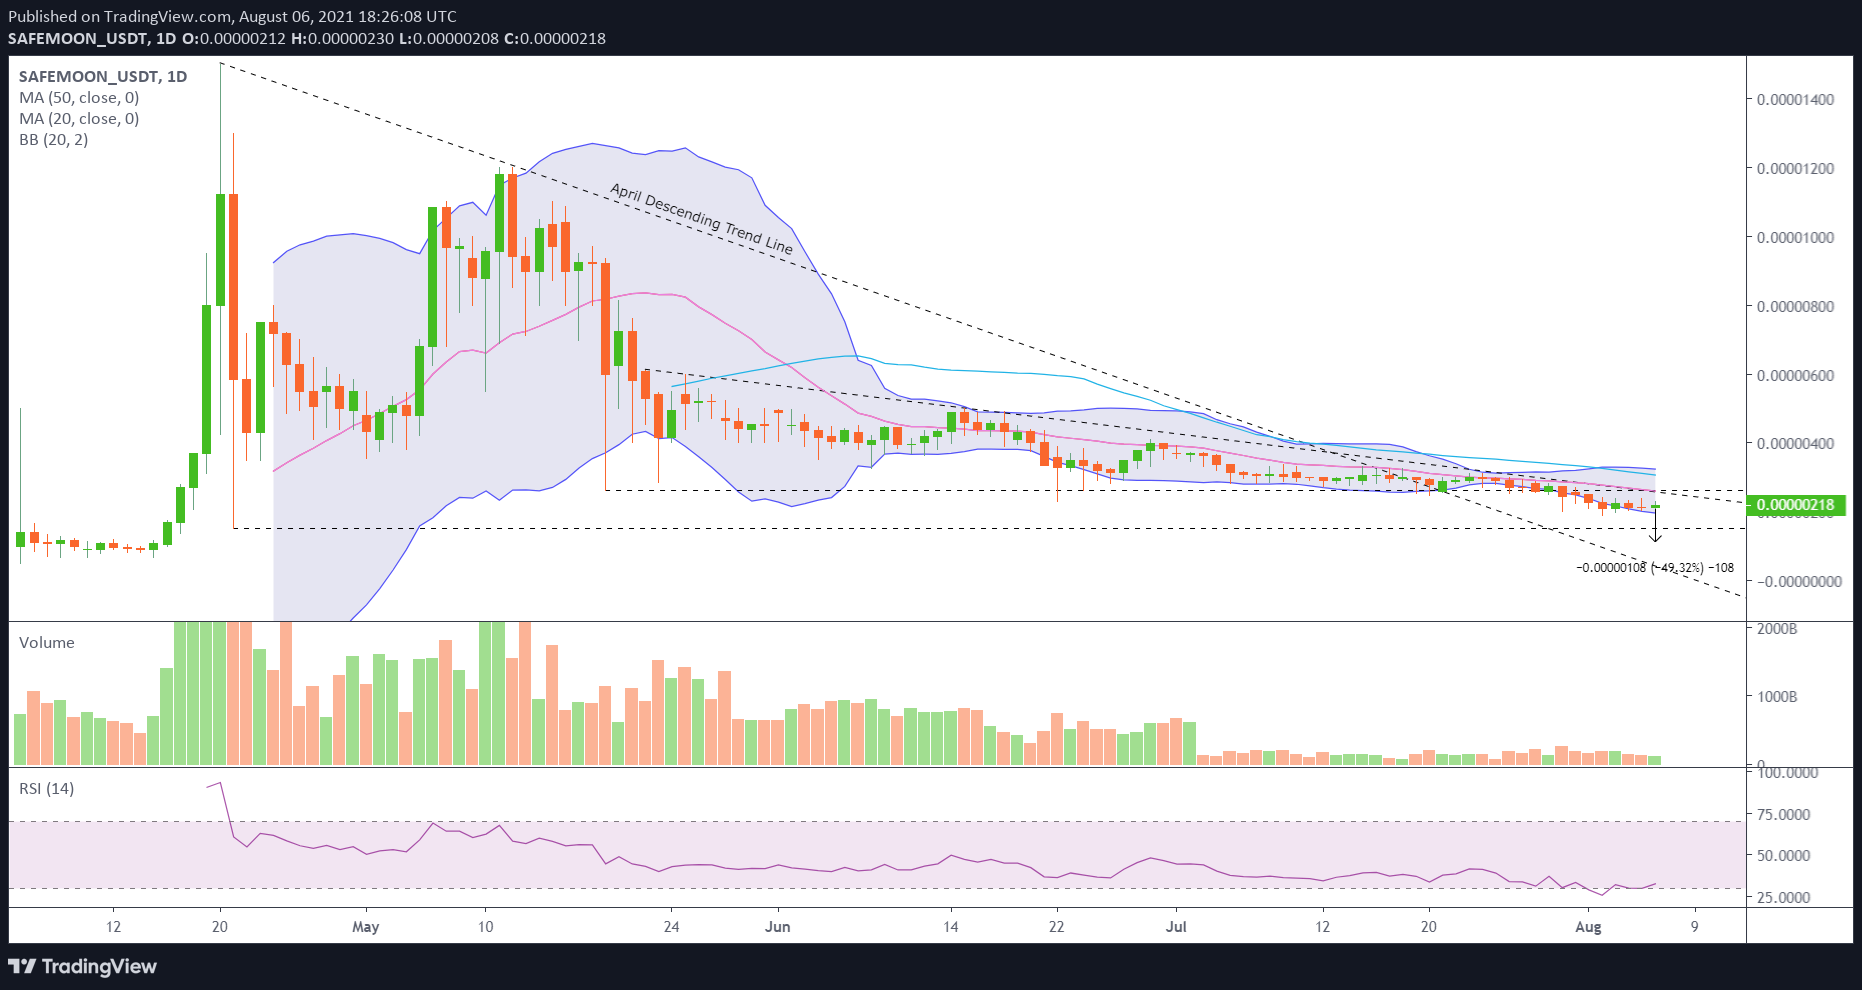
SAFEMOON/USD daily chart
A daily SafeMoon price close above a trifecta of resistance, framed by the May 19 low of $0.00000261, the 20-day SMA at $0.00000260 and the upper trend line of the descending triangle, also at $0.00000260, would alert SAFEMOON investors to a possible change in the bearish forecast.
Overall, the negative deviation of SafeMoon price from the bullish trend in the cryptocurrency complex since July 21, coupled with the weak price action heading into the launch of the Android-based wallet, confirms that the SAFEMOON outlook should be tilted bearish and recommends not being reckless with investment decisions.
Author

Sheldon McIntyre, CMT
Independent Analyst
Sheldon has 24 years of investment experience holding various positions in companies based in the United States and Chile. His core competencies include BRIC and G-10 equity markets, swing and position trading and technical analysis.


