THORChain price leaps 12% with soaring open interest as RUNE targets a peak of its current range
- THORChain price is up 12% in the last 24 hours, reclaiming the $1.932 range high while outperforming the broader market.
- RUNE could sustain the uptrend with growing momentum, reaching the $2.029 range high.
- Coinglass data records a 26% increase in open interest, rising by $13 million in 24 hours.
- Invalidation of the bullish outlook will occur upon a decisive daily candlestick close below $1.639.

THORChain (RUNE) price is testing a crucial multi-month obstacle after a remarkable climb. The move has completed the altcoin’s recovery rally following the 15% fall of September 27. With this, RUNE has outperformed the broader market, with Bitcoin (BTC) and Ethereum (ETH) recording only up to 3% in daily gains.
Also Read: Top 3 Price Prediction: Bitcoin, Ethereum, Ripple: BTC, ETH, XRP at catch-22 moment.
THORChain targets peak of its current range
THORChain price has recorded a 12% surge over the last day, with its market capitalization soaring 11%, far higher than the wider market, which is up only 1.3% over the same timeframe. The trading volume is up 15% in 24 hours, pointing to significant investor activity around RUNE. Coinglass data records a 26% increase in open interest, rising by $13 million in 24 hours.
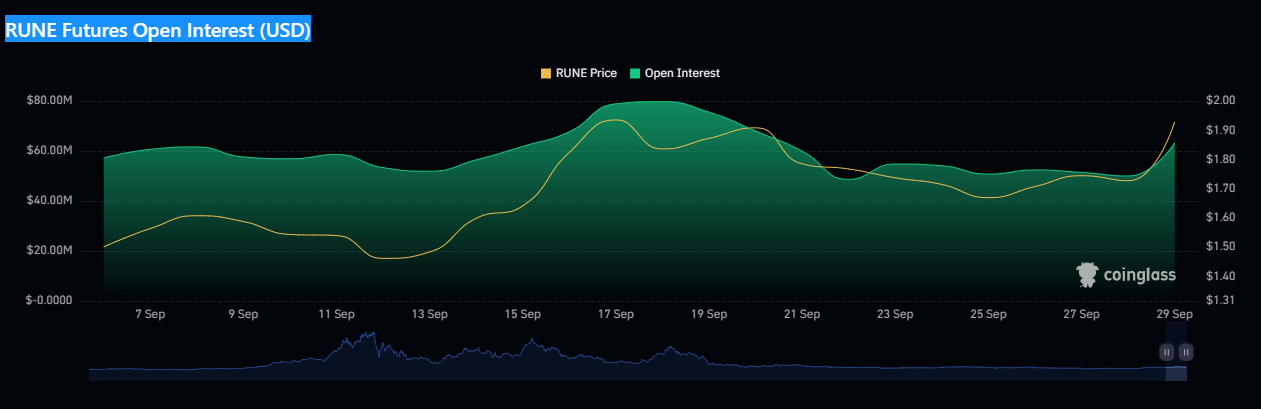
RUNE Open Interest
From a technical standpoint, THORChain price could continue the uptrend, considering the Relative Strength Index (RSI) remains northbound. Similarly, the histogram bars of the Awesome Oscillator (AO) are soaked in green, meaning bulls have a strong presence in the market.
Meanwhile, the $0.793 low recorded around mid-June remains pivotal for THORChain price after a 60% fall, marking the comeback for bulls. The ensuing buying pressure sent RUNE 150% north to record an intra-day high of $2.029 on August 19 before a quick correction to find support around the $1.338 level. THORChain established a market range between $1.955 and $1.391 with this move.
A range of this demeanor often provokes price fluctuations from both extremes, particularly when the price breaches the boundaries.
Based on the Elliott Wave theory, THORChain price is currently in the fifth and final wave of an upward trajectory as part of a movement that began in June. This theory often serves in longer-term setups. One crucial element on the chart is the symmetrical triangle in wave four of the daily chart above, which is often noticeable whenever the price action mirrors the Elliott Wave pattern.
If the wave count is accurate, THORChain price could peak at around $2.459, marked by the 161.8% Fibonacci extension measured from the fourth wave.

RUNE/USDT 1-day chart
Conversely, a break and close below the $1.639 support level would invalidate the bullish outlook. This level marks the bottom of the last lower high. This could send the THORChain price to the $1.391 support level.
Bitcoin, altcoins, stablecoins FAQs
What is Bitcoin?
Bitcoin is the largest cryptocurrency by market capitalization, a virtual currency designed to serve as money. This form of payment cannot be controlled by any one person, group, or entity, which eliminates the need for third-party participation during financial transactions.
What are altcoins?
Altcoins are any cryptocurrency apart from Bitcoin, but some also regard Ethereum as a non-altcoin because it is from these two cryptocurrencies that forking happens. If this is true, then Litecoin is the first altcoin, forked from the Bitcoin protocol and, therefore, an “improved” version of it.
What are stablecoins?
Stablecoins are cryptocurrencies designed to have a stable price, with their value backed by a reserve of the asset it represents. To achieve this, the value of any one stablecoin is pegged to a commodity or financial instrument, such as the US Dollar (USD), with its supply regulated by an algorithm or demand. The main goal of stablecoins is to provide an on/off-ramp for investors willing to trade and invest in cryptocurrencies. Stablecoins also allow investors to store value since cryptocurrencies, in general, are subject to volatility.
What is Bitcoin Dominance?
Bitcoin dominance is the ratio of Bitcoin's market capitalization to the total market capitalization of all cryptocurrencies combined. It provides a clear picture of Bitcoin’s interest among investors. A high BTC dominance typically happens before and during a bull run, in which investors resort to investing in relatively stable and high market capitalization cryptocurrency like Bitcoin. A drop in BTC dominance usually means that investors are moving their capital and/or profits to altcoins in a quest for higher returns, which usually triggers an explosion of altcoin rallies.
Author

Lockridge Okoth
FXStreet
Lockridge is a believer in the transformative power of crypto and the blockchain industry.



