THORChain price rises 20% to beat Shiba Inu in weekend gains; Why RUNE may be due for a 25% crash
- RUNE price is up 20% in weekend gains, 50% from the monthly low of $0.906 to auction at $1.328.
- Notably, while THORChain price is on an uptrend, open interest is falling, suggesting a weakening market.
- Unless bulls can sustain the rally, THORChain price eyes a 25% correction as the supply-demand imbalance grows.

THORChain (RUNE) ranks the biggest gainer this weekend, boasting a multi-month high. The striking rally has seen RUNE beat Shiba Inu (SHIB) price in daily gains. The settlement layer token has also outperformed Bitcoin (BTC) and Ethereum (ETH), which continue oscillating along equilibrium levels in a market devoid of impulse.
Also Read: Ethereum price hovers around equilibrium as ETH future-based ETF filings await October verdict.
RUNE records 20% weekend gains with sustainability in doubt
RUNE, the ticker for the THORChain settlement layer, is trading with a bullish bias, boasting a staggering 50% climb from the August 1 low of $0.910. The striking rally has seen the altcoin shatter past multiple roadblocks, flipping them into support levels and jumping off points to record higher highs.
After touching the bottom of the resistance order block (red), RUNE may be due for a pullback, breaking below the 200-, 100-, and 5—day Exponential Moving Averages (EMA) at $1.281, $1.082 and $1.021 levels, respectively, before tagging the demand zone (blue), which is a bullish order block. This would be the likely point for a correction north and would have constituted a 25% drop from current levels.
However, if the demand zone fails to hold as support and THORChain price breaks below it and flips it into a resistance (bearish breaker), RUNE could continue south, potentially to the $0.777 support floor.
After deflecting from its northbound move, the Relative Strength Index (RSI) is more inclined to this bearish outlook than the upside. Its position at 85 is also concerning, although a correction has yet to be confirmed.
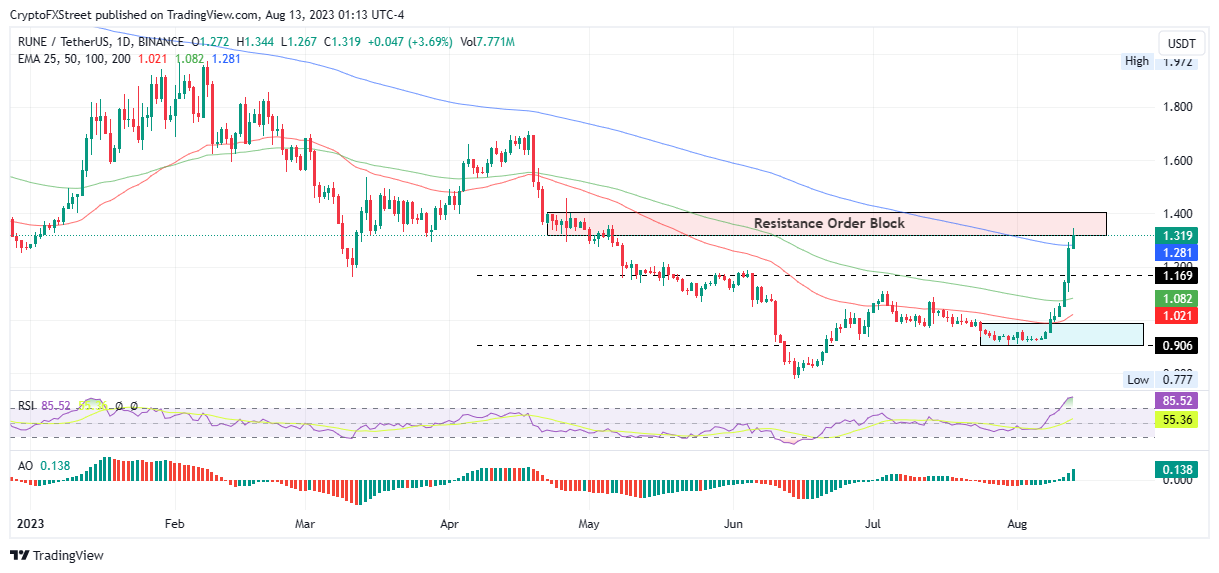
RUNE/USDT 1-day chart
On-chain metric: Open Interest
Further supporting the pending pullback thesis is the Open Interest, an on-chain metric that shows the sum of short and long positions for the asset. This technical indicator helps traders understand the market, whether it is gaining strength or losing momentum.
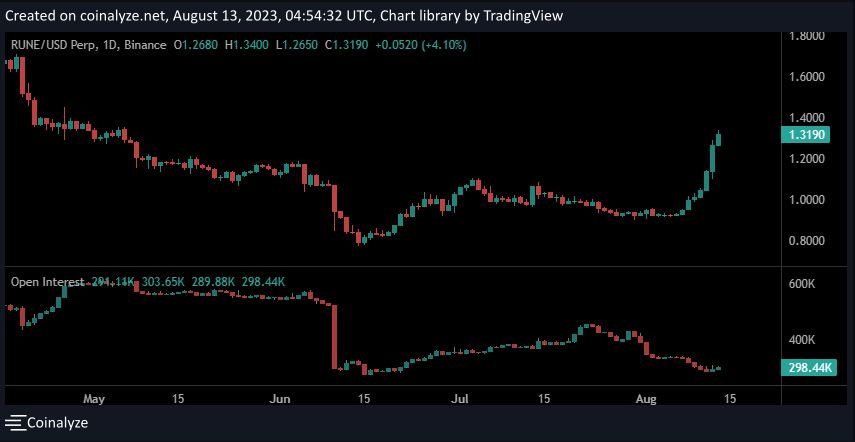
RUNE Open Interest
As shown in the chart above, while RUNE price has been on an uptrend, the open interest has steadily declined. This points to a weakening market and suggests that the rising price trend is developing because traders are buying back borrowed securities so that they can close out their open short position at a profit or loss. It is not attributed to fundamental demand. When this happens, there is capital outflow from the market, and when the short covering has run its course, the RUNE price will start to decline.
However, it is worth mentioning that the RSI still needs to confirm what Welles Wilder says about an overbought asset. In his opinion, an asset is only overbought once the RSI crosses 70 to the downside. As such, RUNE price may continue north, shattering past the resistance order block or supply zone and flipping it to support, thereby rendering it a bullish breaker. A confirmed move above this zone could delay the bearish thesis.
Cryptocurrency metrics FAQs
What is circulating supply?
The developer or creator of each cryptocurrency decides on the total number of tokens that can be minted or issued. Only a certain number of these assets can be minted by mining, staking or other mechanisms. The algorithm of the underlying blockchain technology defines this. Since its inception, 19,445,656 BTCs have been mined, which is the circulating supply of Bitcoin. On the other hand, circulating supply can also be decreased via actions such as burning tokens or mistakenly sending assets to addresses of incompatible blockchains.
What is market capitalization?
Market capitalization is the result of multiplying the circulating supply of a certain asset by the asset’s current market value. For Bitcoin, the market capitalization at the beginning of August 2023 is above $570 billion, resulting from the more than 19 million BTC in circulation multiplied by the Bitcoin price around $29,600.
What is trading volume?
Trading volume refers to the total number of tokens for a specific asset transacted or exchanged between buyers and sellers within set trading hours, for example, 24 hours. It is used to gauge market sentiment; this metric combines all volumes on centralized exchanges and decentralized exchanges. Increasing trading volume often denotes the demand for a certain asset as more people buy and sell cryptocurrency.
What is funding rate?
Funding rates are designed to encourage traders to take positions and ensure perpetual contract prices match spot markets. It defines a mechanism by exchanges to ensure that future and index prices' periodic payments converge regularly. When the funding rate is positive, the price of the perpetual contract is higher than the marked price. This means traders who are bullish and have opened long positions pay traders who are in short positions. On the other hand, a negative funding rate means perpetual prices are below the mark price, and hence traders with short positions pay traders who have opened long positions.
Author

Lockridge Okoth
FXStreet
Lockridge is a believer in the transformative power of crypto and the blockchain industry.




