This Binance Coin price pattern breakout forecasts $1,000 per BNB
- Binance Coin price consolidates inside a Bullish Pennant pattern.
- This setup forecasts a nearly 63% rally to $1,005 for BNB.
- A daily candlestick close below $526 will invalidate the bullish thesis.

Binance Coin (BNB) price has been in a tight rangebound movement for nearly 11 weeks. With each passing daily candlestick close, BNB gets squeezed more, suggesting a steady decline in volatility. These types of compressive price actions are typically followed by a massive breakout, and that’s what awaits BNB.
Also read: BNB price eyes $400 as Binance Coin bulls keep showing up
Binance Coin price eyes breakout
Binance Coin price shot up 63% between March 6 and 16, setting up a local top at $646. This impressive uptrend, which only took BNB ten days to go from $394 to $646, was followed by a consolidative phase that exists as of Saturday.
Combining the Binance Coin price action from March 6 to June 1 shows the formation of a bullish continuation pattern known as a Bullish Pennant. The aforementioned 63% rally is the flag pole, and the sideways movement that produced lower highs and higher lows is the pennant.
The forecast for this setup is determined by adding the flag pole's height to the breakout point. In Binance Coin’s case, assuming the breakout occurs at $616, the flag pole’s height shows that the Bullish Pennant target for BNB is $1005. This ambitious target is roughly 45% away from the all-time high of $692.90.
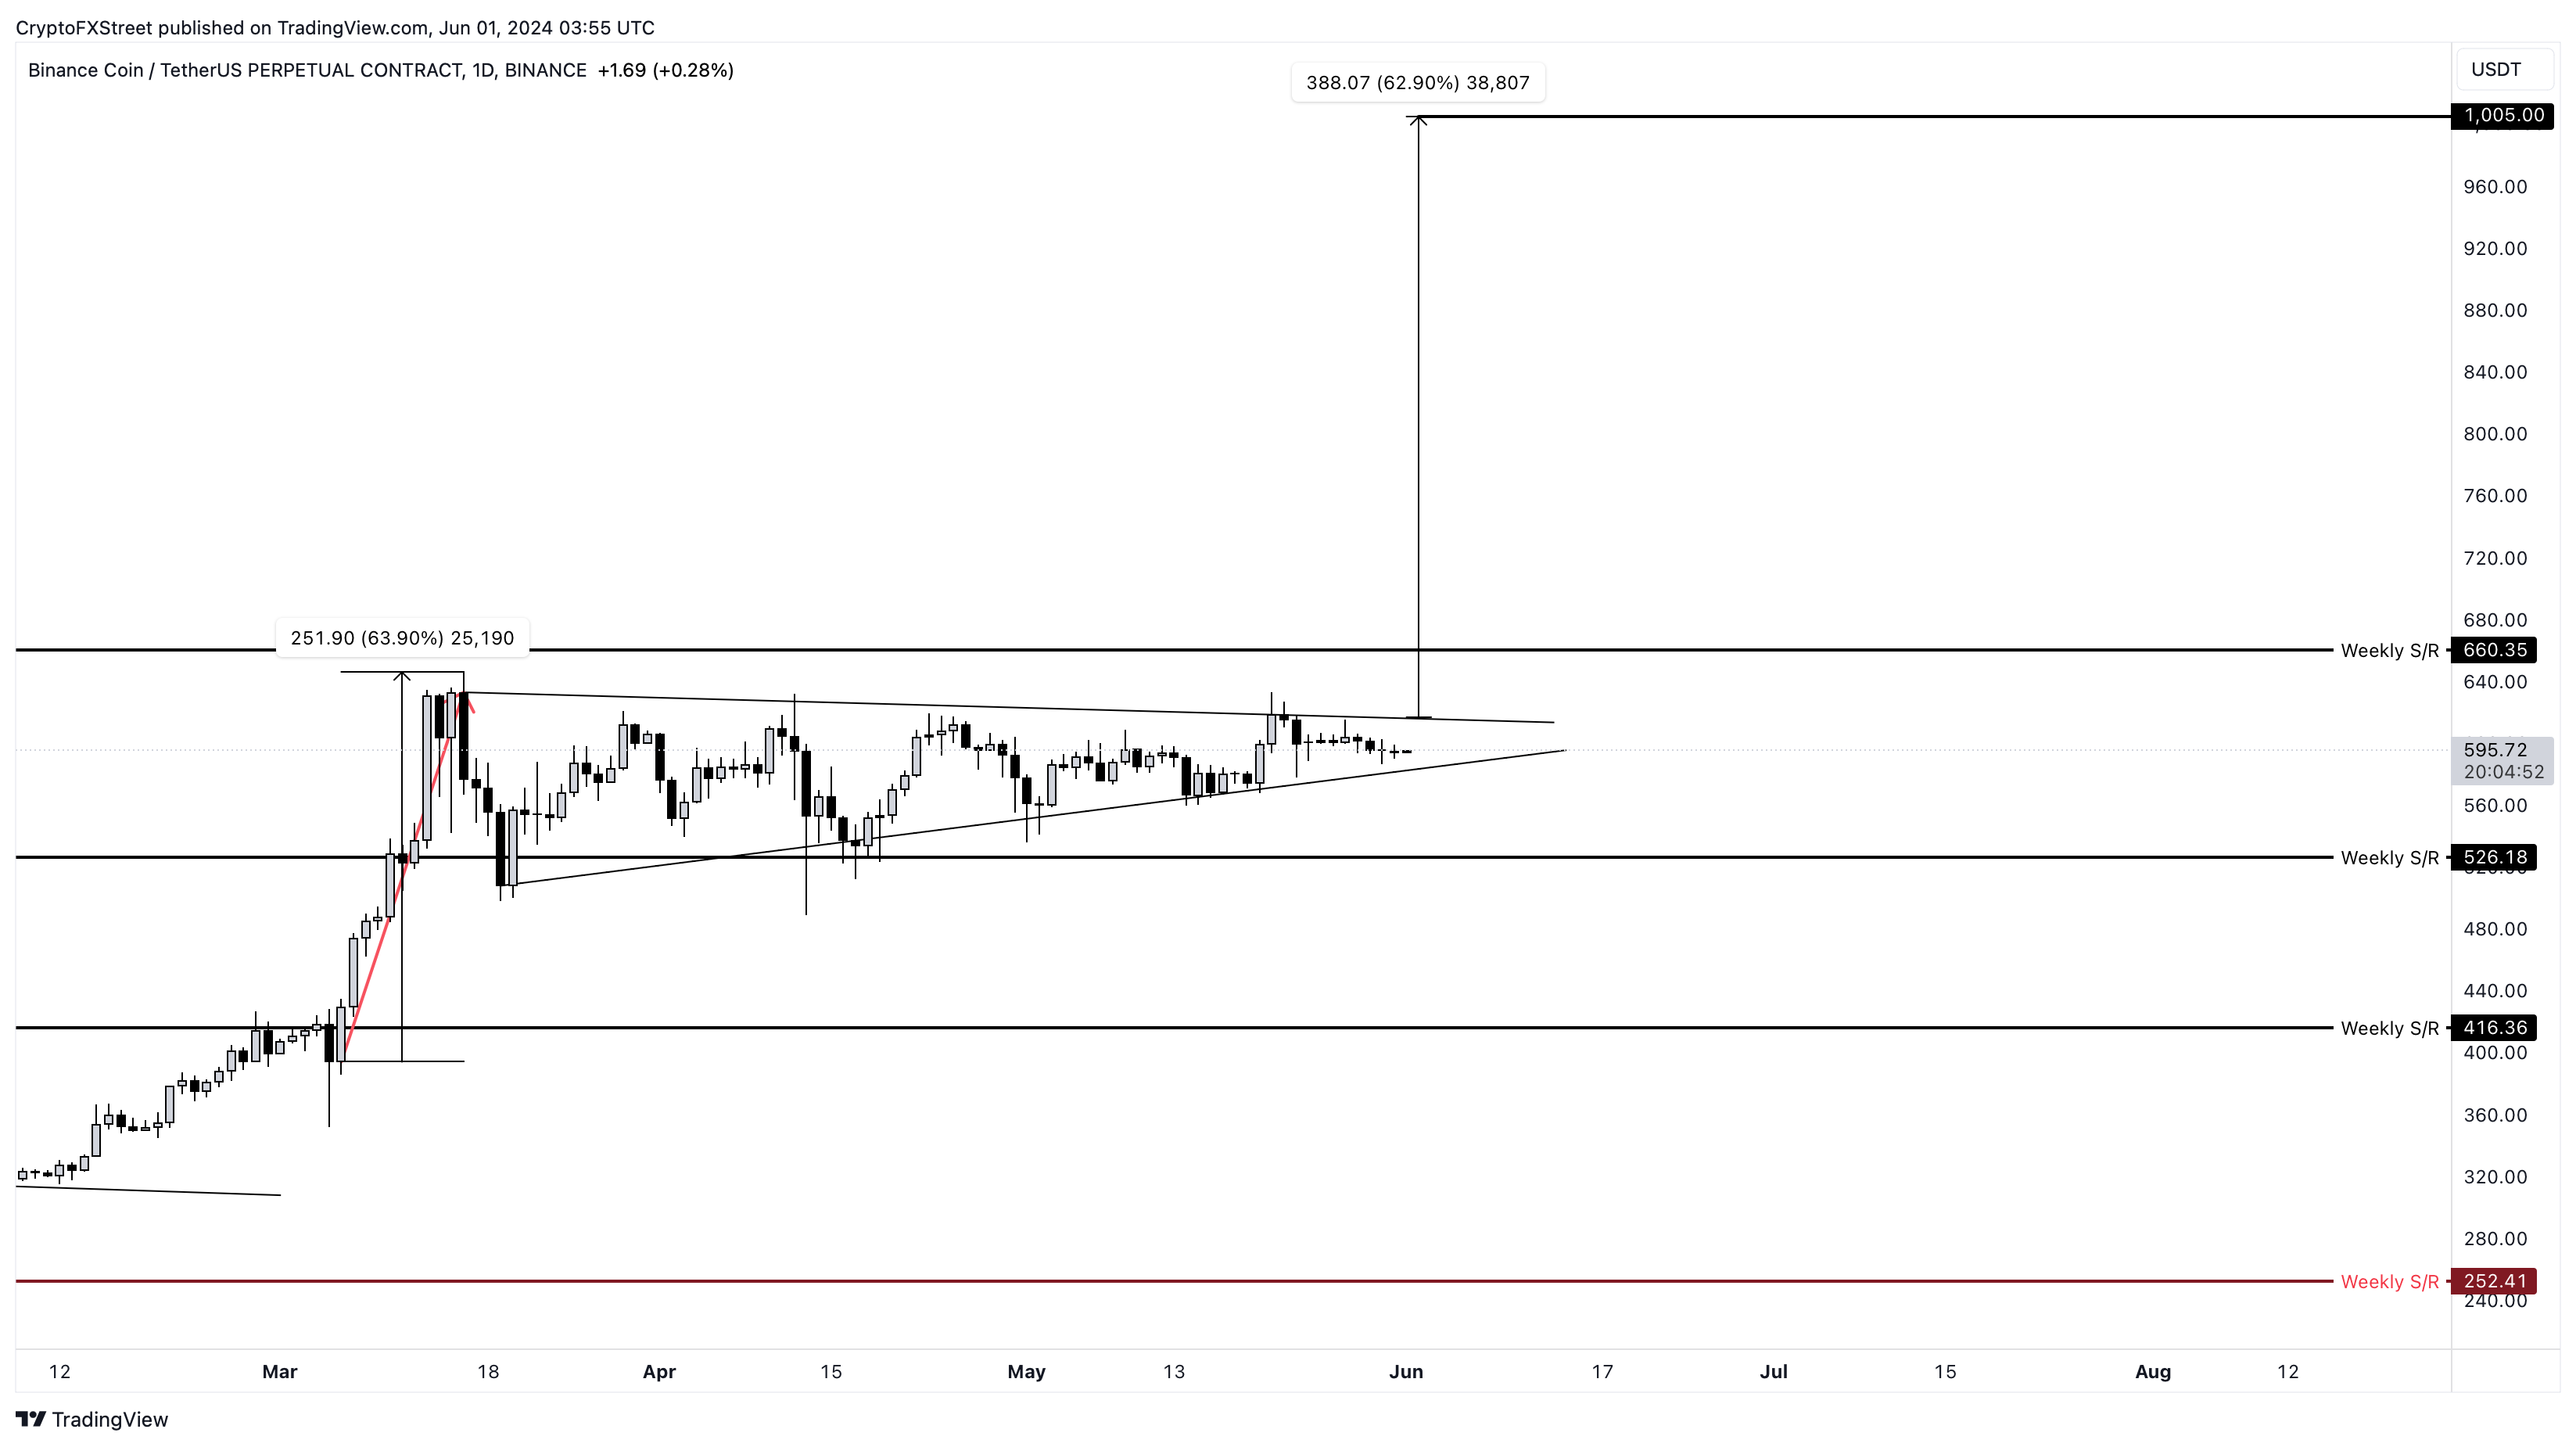
BNB/USDT 1-day chart
On the contrary, if the market outlook worsens, sending Bitcoin (BTC) price down to $60,000, then it could disrupt the Binance Coin price pattern, leading to a bearish breakout. This move would invalidate the bullish pennant pattern. In such a case, BNB could slide 9% and retest the $526 support level. A daily candlestick close that flips this support into a resistance level, would suggest the potential start of a downtrend.
Author

Akash Girimath
FXStreet
Akash Girimath is a Mechanical Engineer interested in the chaos of the financial markets. Trying to make sense of this convoluted yet fascinating space, he switched his engineering job to become a crypto reporter and analyst.