THETA Price Prediction: THETA faces acute resistance under $8 amid sprouting selling signals
- THETA is in the middle of a correction after hitting a barrier at the all-time high of $8.
- The TD Sequential indicator has flashed two sell signals on the 4-hour and 12-hour charts.
- Support at $7 could see THETA resume the uptrend and launch an assault on the record high.

THETA has been rejected from the all-time high and is dancing at $7 at the time of writing. The correction comes after a persistent rise in price from the beginning of the year. As the upward momentum lost traction, bears rushed in with a mission to assault higher support levels. If the immediate support at $7 fails to hold, massive selling orders may trigger, increasing the overhead pressure.
THETA hangs at the edge of a high cliff
THETA bulls seem to have minimal control over the price, especially with the emerging selling signals. Overhead pressure is mounting under the ascending parallel channel's upper boundary. On the downside, trading under $7 would allow the bearish leg's extension to the channel's middle boundary.
The Moving Average Convergence Divergence (MACD) reinforces the bearish outlook. The trend momentum tracker has hit a snag in its uptrend and appears to be correcting toward the mean line. If the MACD line (blue) crosses under the signal line, more losses will come into play.
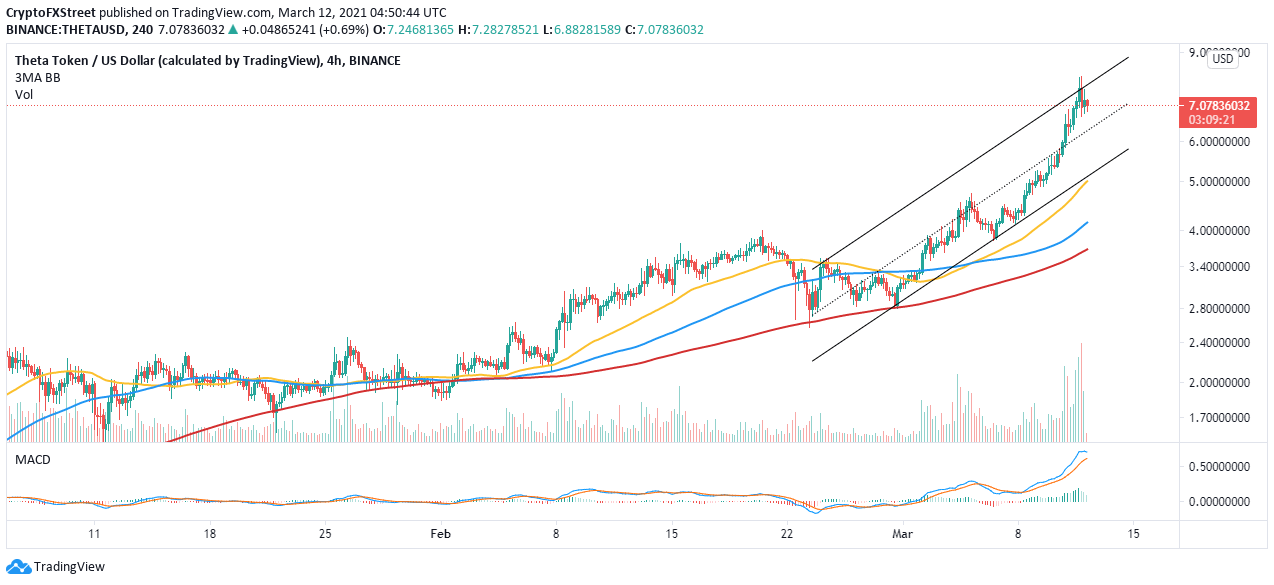
THETA/USD 4-hour chart
The TD Sequential Indicator has recently flashed two sell signals on the 4-hour and 12-hour charts. This calls to sell manifested in green nine candlesticks. They signal that the uptrend is reaching exhaustion while bears are preparing to take over control. If validated, THETA may fall may appreciably extend the bearish leg, perhaps hit the 50 Simple Moving Average support, reinforced by the ascending channel's lower boundary.
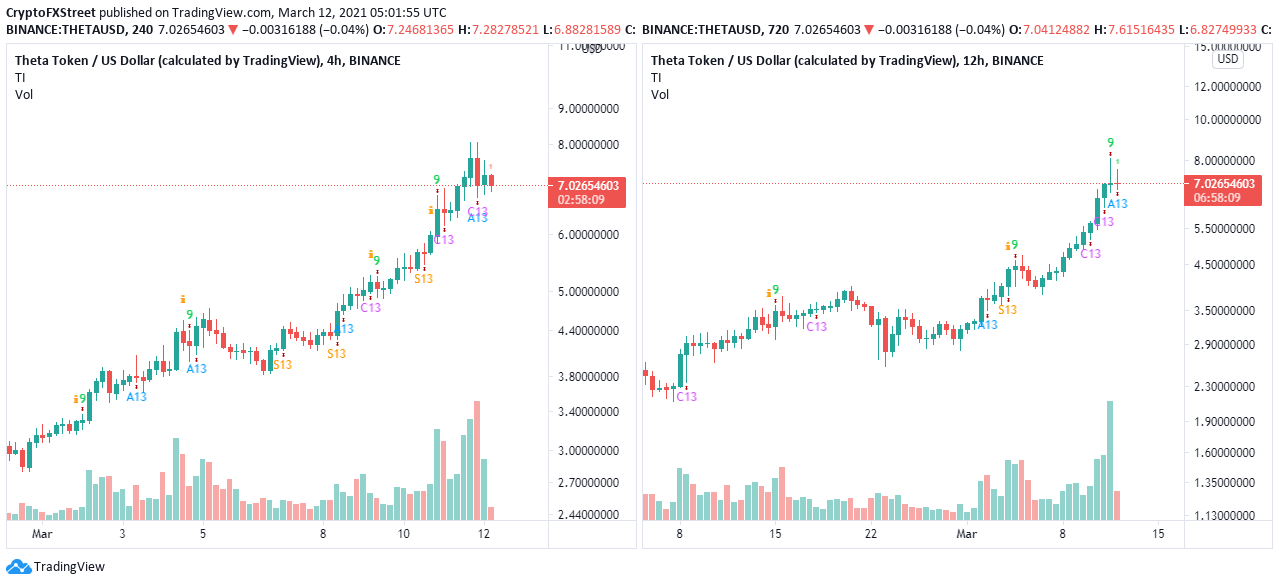
THETA 4/12 hour charts
Looking at the other side of the fence
It is worth mentioning that holding the support at $7 would ensure stability remains in the market. The ascending channel's middle boundary would also play a vital role in ensuring that losses to don extend to $5. On the upside, a break above $8 and the channel's upper boundary would lead to the resumption of the uptrend.
Author

John Isige
FXStreet
John Isige is a seasoned cryptocurrency journalist and markets analyst committed to delivering high-quality, actionable insights tailored to traders, investors, and crypto enthusiasts. He enjoys deep dives into emerging Web3 tren



