Theta price can do an 18% rally, but THETA investors can forget about 50%
- Theta price attempts to continue the massive rally are frustrated by the weight of the declining 50-day simple moving average (SMA).
- THETA closed the week down -6.17% and down -11.64% for July, marking the fourth consecutive negative monthly return.
- A bullish Golden Cross pattern will trigger on the six-hour chart as the 50 six-hour SMA approaches the 200 six-hour SMA.

Theta price rallied over 100% from the July 20 low to the July 26 high, easily besting most cryptocurrencies after trading well below the 50-week SMA. Since July 26, THETA has been contained by the weight of the declining 50-day SMA, now at $6.16. The consolidative process has plotted a symmetrical triangle on the six-hour chart with the potential to drive the altcoin to the 200-day SMA at $7.14.
Theta price compressed, seeking symmetry for the next leg higher
At the July 20 low, Theta price had recorded an oversold condition on the daily Relative Strength Index, setting the foundation for the massive 100% gain over the next six days. The THETA rally quickly overwhelmed the resistance attributed to the May 23 low at $4.54 and the June 22 low of $5.21 before briefly trading above the 50 and 200-day SMAs.
The resulting price compression generated by the sharp advance is being released as Theta price consolidates below the tactically important 50-day SMA. The sideways price action has shaped a symmetrical triangle on the THETA six-hour chart with a measured move of 18%.
A potential factor in how the symmetrical triangle resolves is the approaching bullish Golden Cross pattern on the six-hour chart. It may direct a bullish resolution of the pattern and a continuation of the Theta price rally to the 200-day SMA.
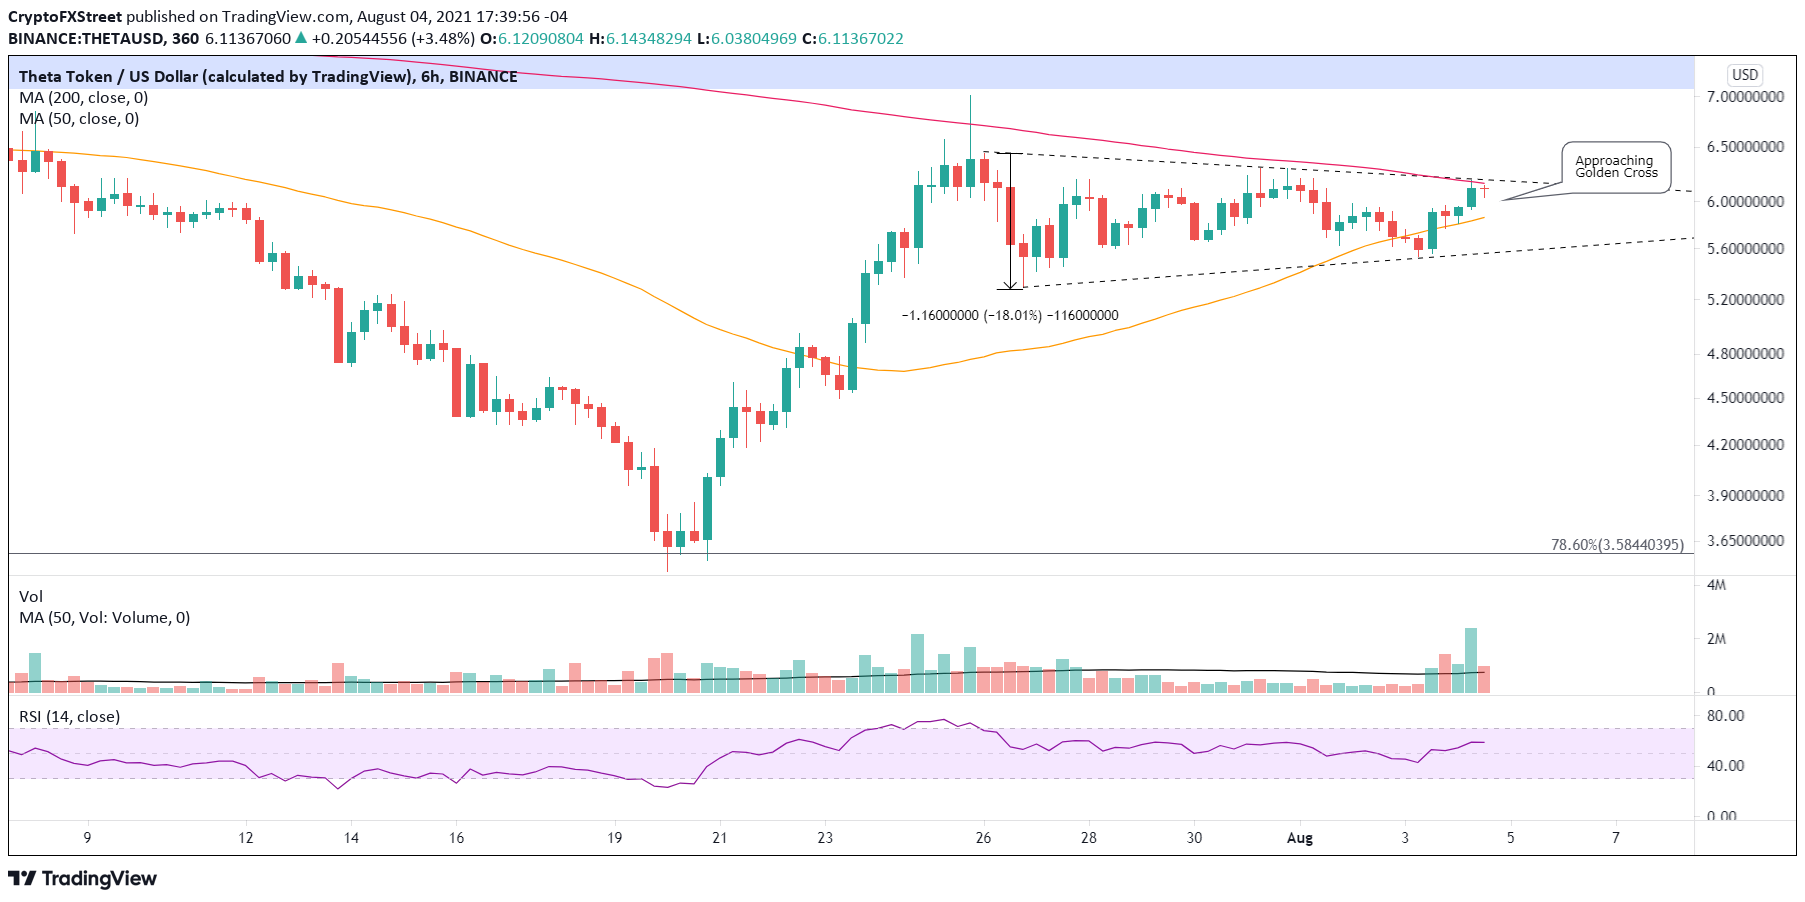
THETA/USD 6-hour chart
The 18% measured move of the intra-day symmetrical triangle places Theta price above the 200-day SMA but not above the July 26 high of $7.60. Instead, THETA will be stranded in a range of price congestion that includes the April 23 low and several highs in late June.
Adding to the intensity of the resistance is the April descending trend line that is currently crossing the 200-day SMA. Thus, a successful breakthrough from the Theta price range between $7.14 and $7.75 may require more than one attempt, confirming that the easy money has been made in THETA.
Above $7.75 Theta price can advance to a new price range framed by a series of highs printed in May and June between $9.70 and $10.80, delivering a 50% return from the 200-day SMA.
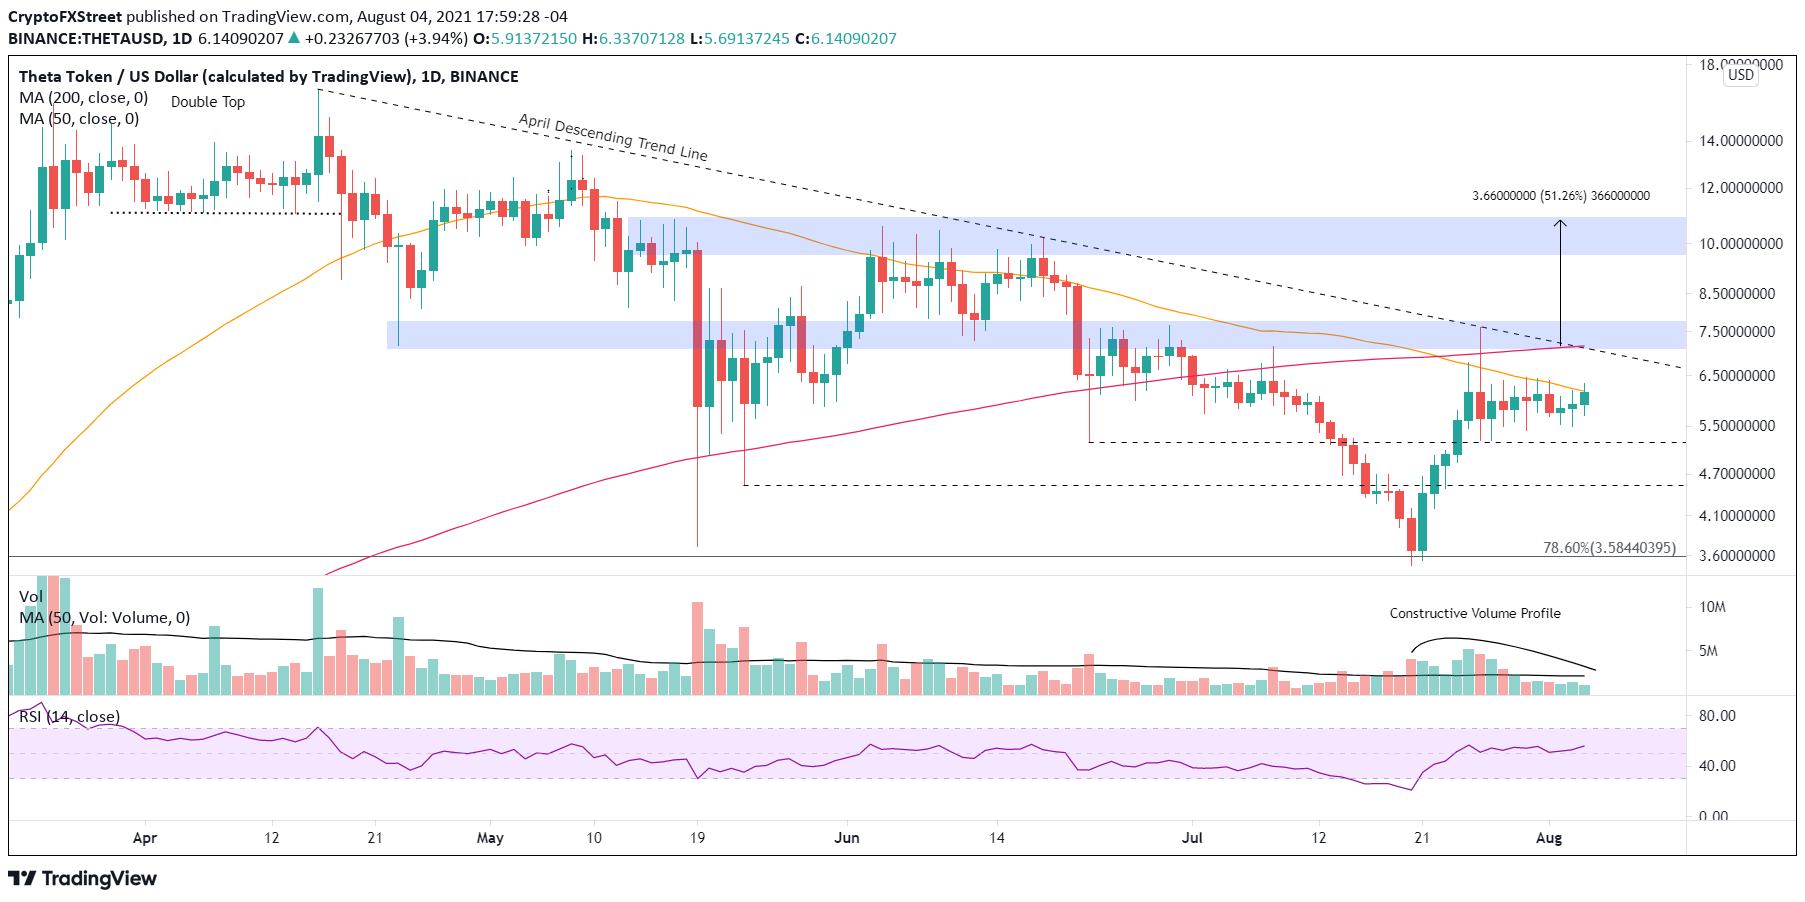
THETA/USD daily chart
The consolidation may continue, but Theta price must hold the June 22 low of $5.21. Otherwise, THETA may plummet to the May 23 low of $4.54 or the 78.6% Fibonacci retracement of the 2020-2021 advance at $3.58, logging a decline of 30% from the June 22 low.
To conclude, it is essential to point out that THETA is not in the best situation based on the position of Theta price within the larger price structure. Yes, it held the 50-week sma two weeks ago, but it is trading below the key daily moving averages and is negatively influenced by the recent bearish Death Cross pattern when the 50-day SMA fell below the 200-day SMA. All are creating a headwind for a bullish outlook.
In the short term, there is a high probability that Theta price can resolve the symmetrical triangle to the upside and lock in the measured move of 18%. However, more significant THETA returns will be a battle that will not be won without multiple attempts.
Author

Sheldon McIntyre, CMT
Independent Analyst
Sheldon has 24 years of investment experience holding various positions in companies based in the United States and Chile. His core competencies include BRIC and G-10 equity markets, swing and position trading and technical analysis.



