Theta price gains over 100%, confirms a bullish trend change
- Theta price registers the best five-day gain since March 11 as the cryptocurrency explodes off the 78.6% Fibonacci retracement.
- THETA holds the strategically important 50-week simple moving average (SMA), maintaining the uptrend from March 2020.
- Commanding resistance begins at $7.00, suggesting the easy money has been made.

Theta price printed a new correction low on July 20, undercutting the May 19 low of $3.70 and the 78.6% retracement level of $3.54 before rallying 100% into yesterday’s high. The convergence of key resistance levels prevented an extension of the rally and revealed the struggles for THETA moving forward. With the resistance firm and near, the easy money has been made in the cryptocurrency.
Theta price overcomes the storm to drive the cryptocurrency market higher
Theta price corrected almost 80% from the April high of $16.61, retracing 78.6% of the advance that began in March 2020 and recording the most oversold reading on the daily Relative Strength Index (RSI) since November 2018.
The THETA response to the remarkable decline was a successful test of the May 19 crash, followed by a 68% rally from July 21 to July 25, marking the third-best five-day gain since December 2018 and a renewal of commitment and emotion in THETA.
Yesterday the THETA rally concluded with an expansive reversal after Theta price struck overwhelming resistance. The resistance combines the 50-day simple moving average (SMA) at $6.59, the 200-day SMA at $6.98, the April descending trend line at $7.56 and a range of price congestion beginning with the April 23 low at $7.16. Adding to the weight of the resistance is the triggering of a bearish Death Cross pattern on July 23.
With the presence of the THETA price barrier, Theta price faces a new challenge that will dictate a period of consolidation to release the price compression of the market-leading 100% gain with the specific goal of establishing the technical foundation to turn the brief THETA rally into a sustainable advance.
Points of support include the June 22 low of $5.21 and the May 23 low of $4.54. A failure to control the pullback to the May 23 low raises the odds that the THETA rally was a dead cat bounce, and a new correction low could be in the future.
Based on the impulsiveness of the rally on a historical basis and relative to the weaker rebounds during the April-June correction, Theta price is not currently at risk of a new low.
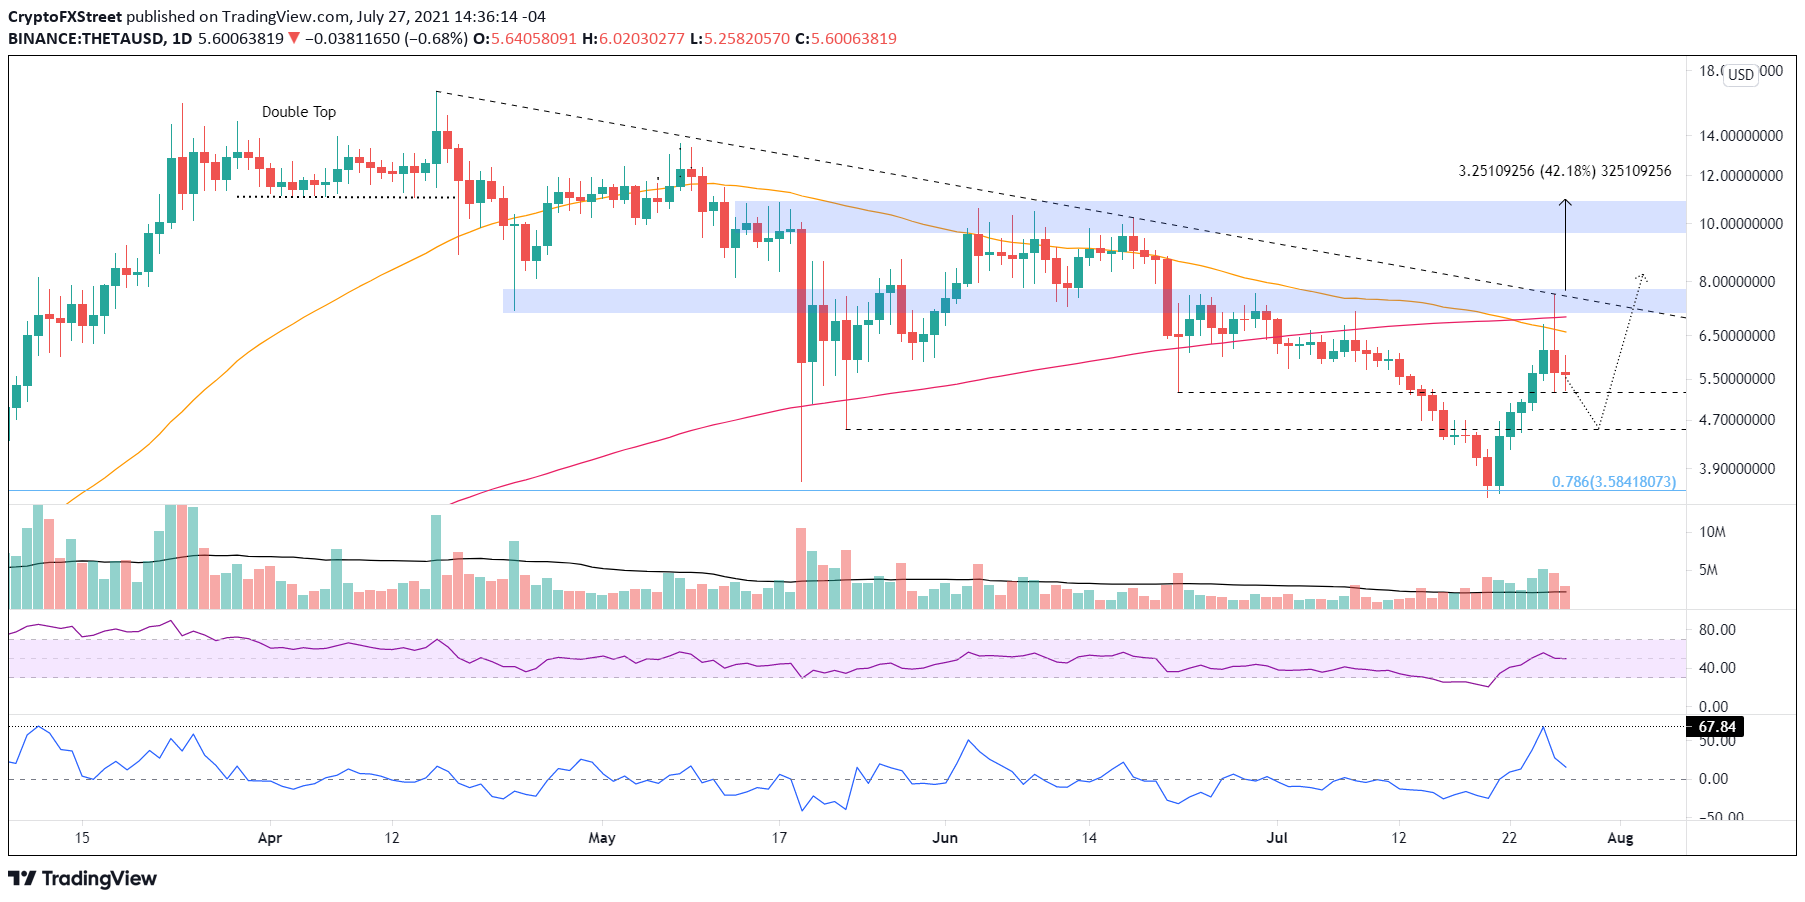
THETA/USD daily chart
To change the cautious short-term outlook, Theta price needs a daily close above $7.75. It would signal that the altcoin is positioned to extend the bounce into an advance, targeting another range of resistance from $9.70 to $10.90, equaling a 40% return up to the upper limit of the range.
The Theta price rally of over 100% from the July low changed the entire price structure. It easily surpassed the gains of previous bounces during the three-month correction, proving the meaning of impulsiveness and the introduction of a trend change. In the short term, THETA encounters a technical challenge between $7.10 and $7.75. Hence, investors need to be patient in the coming days and weeks to let the next stage of opportunity to materialize.
Author

Sheldon McIntyre, CMT
Independent Analyst
Sheldon has 24 years of investment experience holding various positions in companies based in the United States and Chile. His core competencies include BRIC and G-10 equity markets, swing and position trading and technical analysis.



