These two price levels could define Cardano future
- Cardano price has been guided by the persistent $1.40 price level in 2021, either as resistance or support.
- $1.00 has been instructive on pullbacks, reinforced by the 61.80% Fibonacci retracement of the March 2000 to May 2021 rally.
- The forceful ADA bounce from the 200-day SMA on June 22 confirmed prominent investor interest near $1.00.

Cardano price has framed pronounced levels of support and resistance that could inhibit a definitive trend from developing and, as a result, deliver an ideal trading opportunity for swing traders working off a short-term trading program. The upside is contained around the 2018 high of $1.40, and the support fluctuates around $1.00, based on various indicators.
Cardano price awaits trend confirmation as bulls and bears standoff
The indecision and volatility that has proceeded the sharp correction in May have lead Cardano price to establish definitive support and resistance levels. As the ADA price structure has developed around the price levels, it has revealed a potential forecast of a wide consolidation, awaiting some organic or external catalyst.
On the downside, Cardano price is bolstered by three critical technical indicators, each revolving around the psychologically important $1.00. One of the most widely followed indicators, the strategically important 200-day simple moving average (SMA), denoted by the pink line on the chart below, currently rests at $1.03. The moving average was exceptional support on June 22 as ADA plummeted from a minor head-and-shoulders pattern. Based on the magnitude of the bounce and the rise in volume, it seems that more prominent investors were using the opportunity to accumulate.
A second technical indicator reinforcing $1.00 is the 61.8% retracement level of the March 2000 to May 2021 rally at $1.00. It was also tested on June 22 but was slightly undercut during the May 19 plunge. Like the 200-day SMA, the retracement level is targeted during corrections by larger investors seeking to initiate or increase positions.
A third and equally significant technical indicator is the Anchored VWAP from January 3 at $.98. The Anchored Vwap (denoted by the purple line on the chart) ties VWAP calculations to a specific candlestick chosen by the market operator. The starting bar is selected because it marks a shift in psychology, such as breakout from a meaningful pattern. The Anchored VWAP line is charted using price and volume data from that breakout until the last trading day.
In the case of Cardano price, the anchored price is on January 3 as ADA emerged from a cup with high handle pattern and then rallied over 1000% into the May 16 high of $2.51. The indicator was successfully tested on June 22 around $0.99 and during the May 19 crash near $0.92, thereby strengthening its value within the designated ADA support.
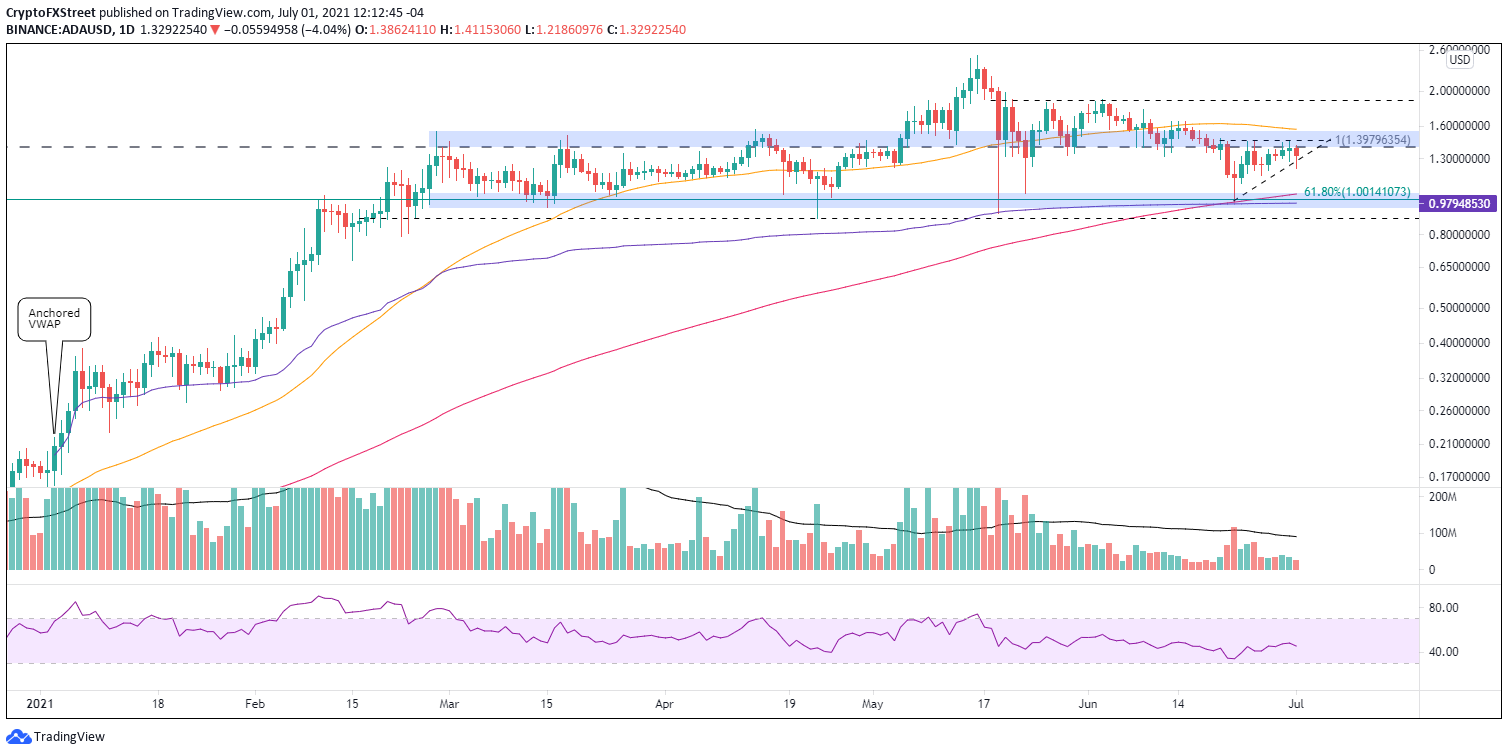
ADA/USD daily chart
On the upside, Cardano price faces one of the most critical resistance levels in the entire cryptocurrency complex, the 2018 high of $1.40. The price level was fundamental in limiting rallies in February, March, and April, either intra-day or daily closing. In late May and mid-June, the level resumed an instructive role in the ADA price action as it provided support before it finally failed on June 21.
A complementary resistance level is $1.46. It marks the highs of the failed ADA rally attempts above $1.40 in late June, forming the horizontal trend line of an ascending triangle. Thus, any rise above $1.40 will be quickly met with further resistance, complicating the upside potential for Cardano price.
The 50-day SMA (denoted by the yellow line on the chart) is currently at $1.57, putting it well above $1.40. Still, it is essential to note that if Cardano price does enter a stage of range-bound trading, the tactically significant moving average will assume a prominent role in the ADA resistance around $1.40.
The weekly chart below highlights how critical the levels have been in influencing Cardano price throughout 2021, particularly on a closing basis. As well, it shows the cup with high handle pattern that triggered the beginning of 2021.
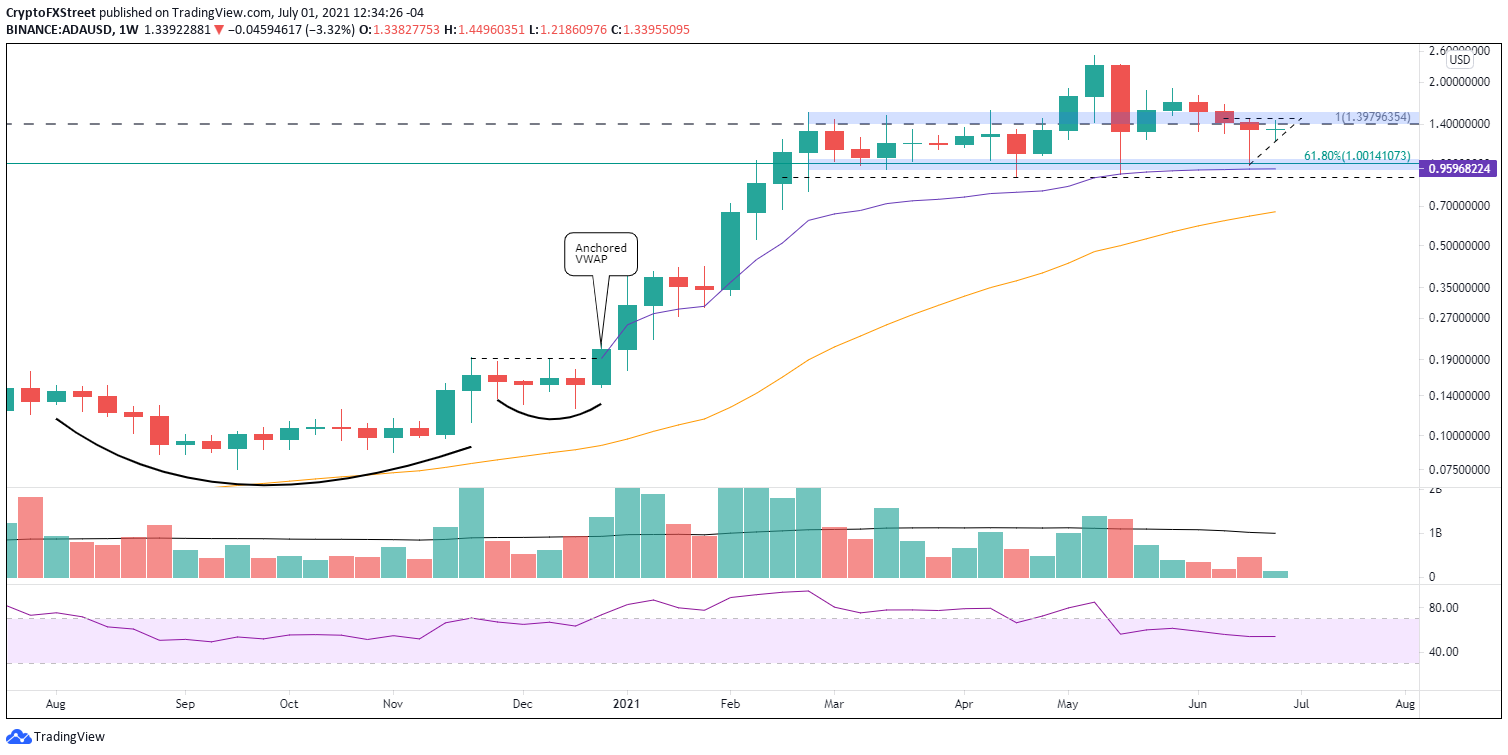
ADA/USD weekly chart
Hence, Cardano's price action could evolve into a range, buffered by $1.40 and supported around the psychologically important $1.00. It is a fantastic opportunity for swing traders and day traders as it offers precise risk levels for measuring ADA trade execution.
A daily, or preferably a weekly close beyond one of those two ADA price levels will yield a definitive trend direction for Cardano price.
Author

Sheldon McIntyre, CMT
Independent Analyst
Sheldon has 24 years of investment experience holding various positions in companies based in the United States and Chile. His core competencies include BRIC and G-10 equity markets, swing and position trading and technical analysis.


