Cardano price may weaken, but psychologically important $1 holds all the cards
- Cardano price may be on pace to close the week with a hammer candlestick pattern.
- ADA tested the 2018 high but was rejected on both attempts.
- Anchored VWAP from January 3 has been credible support in May and June.

Cardano price rebound from the union of the 200-day simple moving average (SMA) with the anchored VWAP originated with a doji candlestick on June 22, followed by consecutive failed attempts to close above 2018 high. The rejection of ADA at the imposing resistance level suggests that the green token may be destined to trade in a wide range in the short term, raising the opportunities for traders but complicating investors.
Cardano price steadies as idyllic narrative reigns supreme on the internet
During the last half of May and the first half of June, Cardano price was indecisive and directional intentions were opaque. Still, the June 21 crash of 17.66% resolved the directionless price structure and, more importantly, shattered the 2018 high of $1.40. The notable decline of June 21 was followed by another sizeable ADA drop on June 22 before capturing support at the 200-day SMA at $.98 and the anchored VWAP, closing with a doji candlestick pattern.
On the one hand, the doji candlestick highlighted a high level of tentativeness among investors, but it also promoted the potential of a trend change. The trend change, potentially brief, was confirmed on June 23 when Cardano price traded above the doji high, setting up consecutive stand-offs between ADA and 2018 high. It was a battle that the altcoin lost in February, March and April of this year, and now in June.
Despite the brief sling-shot higher off the June 22 doji candlestick, Cardano price is surrounded by several technical levels, each of differing importance. More specifically, the 2018 high is intimidating, and the failed attempts indicate that ADA is poised for a pullback, presumably to the 200-day SMA. Cardano price may find a home between those two levels, at least for the short term, presenting precise risk levels for capable traders.
A daily close above the 2018 high of $1.40 will moderately change the skew of the outlook, lifting the probabilities that June 22 was the formative low of the recent sell-off. The 50-day SMA at $1.59 will be a challenge to overcome, as noted by the Cardano price struggles earlier in June. After $1.59, ADA is uncontested until the May 16 all-time high of $2.51, producing an 80% return from the 2018 high.
To achieve the lofty projections highlighted above, Cardano price will need to be more impulsive and determined. The ADA volume profile needs to take on a theme of accumulation, not distribution.
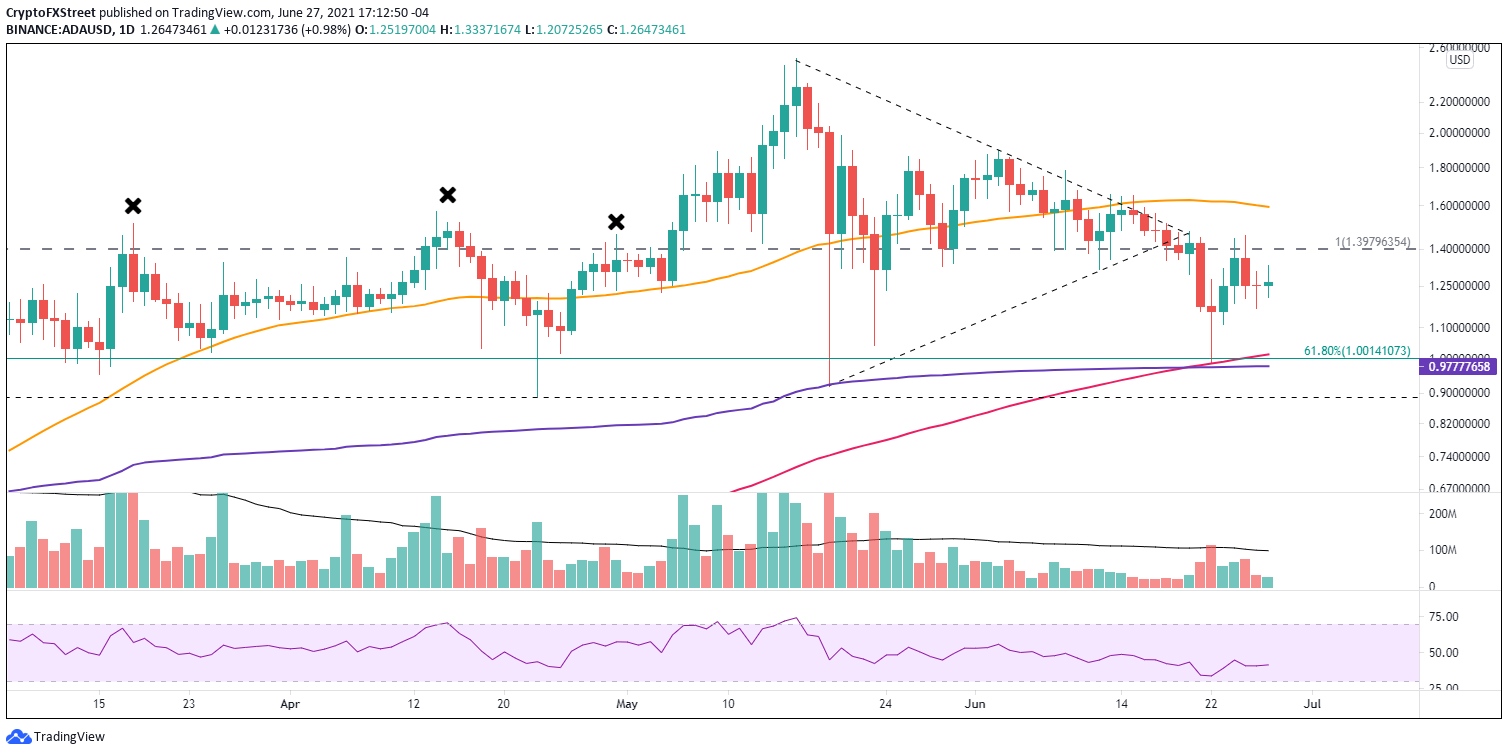
ADA/USD daily chart
Nevertheless, suppose the digital asset can close today with a bullish hammer candlestick pattern on the weekly chart. In that case, investors should prepare for better ADA outcomes in the medium to long term. An outlook that harmonizes with the idyllic fundamental narrative that surrounds Cardano.
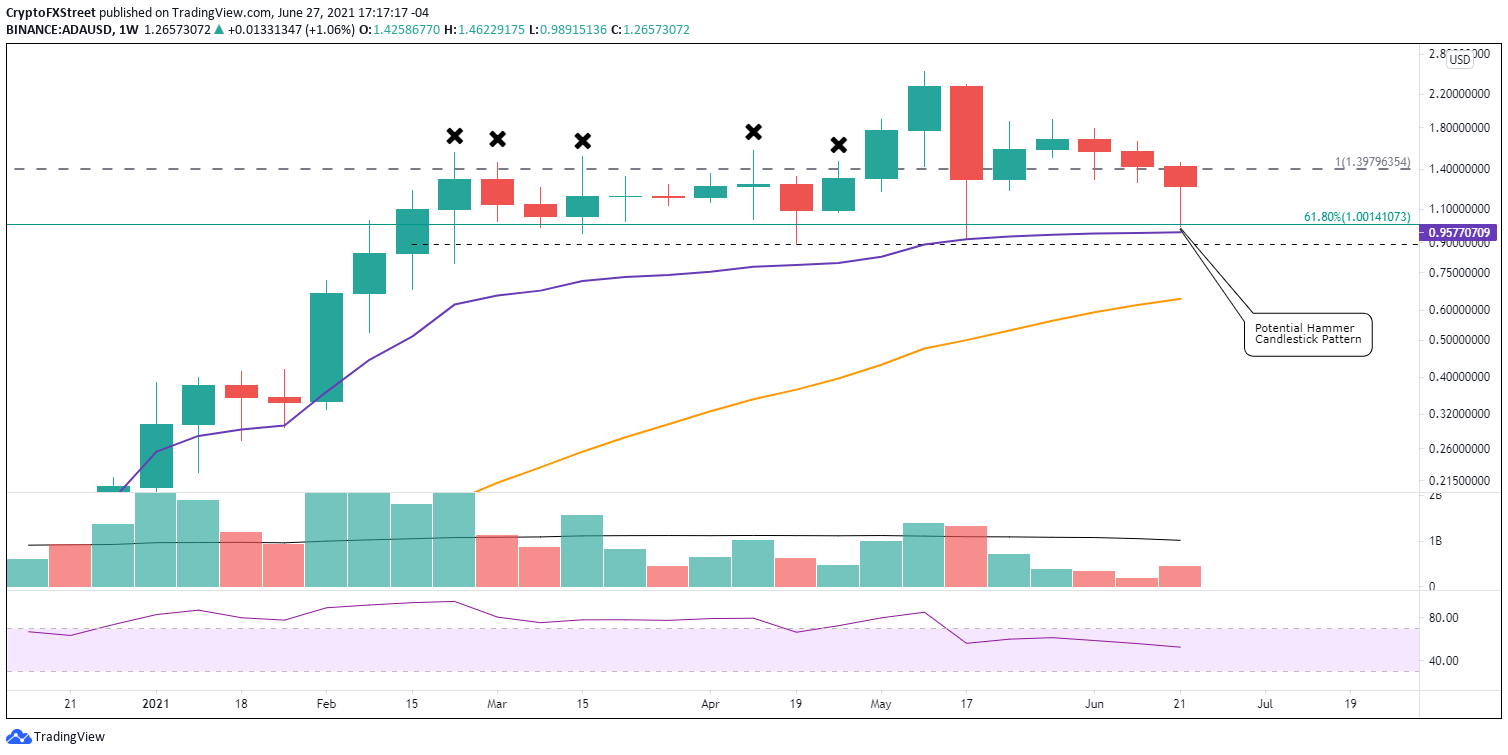
ADA/USD weekly chart
If Cardano does pullback and fails to grab support at either the 200-day SMA at $1.01, 61.8% Fibonacci retracement level of the March 2020-May 2021 advance at $1.00, or anchored VWAP at $0.97, ADA will sweep the May 19 low of $0.91. Hence, the psychologically important $1.00 is the center of attention on weakness.
Under such a scenario, ADA will finally log an oversold reading on the daily Relative Strength Index (RSI), the first since September 23, 2020. It may be a necessary condition to catapult Cardano price above the resistance levels emphasized above.
ADA is one of the few cryptocurrencies to not cut through the May low in June. It could be a sign of relative strength for Cardano price, and it needs to be monitored closely if the cryptocurrency complex regains an upward trajectory. Targeting relative strength after a period of weakness frequently delivers outsized returns and less overall volatility.
Author

Sheldon McIntyre, CMT
Independent Analyst
Sheldon has 24 years of investment experience holding various positions in companies based in the United States and Chile. His core competencies include BRIC and G-10 equity markets, swing and position trading and technical analysis.


