These three altcoins outperformed Bitcoin in March and look primed for further gains
- Chiliz price hints at a bearish outlook, but a bounce from critical levels at $ 0.46 or $0.37 could kick-start another bull run.
- Verasity price is consolidating in a bull flag pattern, suggesting a 75% lift-off soon.
- Kelver price also indicates a continuation of its bull rally as it consolidates in a bullish pennant formation.

Bitcoin price stands nowhere near the year-to-date returns of altcoins like Chiliz, Verasity and Kelver. Despite surging 2,260%, 2,880%, and 877%, respectively, these cryptocurrencies indicate a continuation of the parabolic runs soon.
Chiliz price could rally again if these critical levels hold
Chiliz price is consolidating in a descending triangle pattern, which is a bearish technical formation. This setup forecasts a 47% drop if two demand barriers give in.
The first support that could revive Chiliz’s massive bull run is the 78.6% Fibonacci retracement level at $0.46. If this barrier crumbles, the 61.8% Fibonacci retracement level at $0.26 could provide the buyers enough time to gather steam and push the CHZ price for another bull run.
To invalidate the bearish scenario, the Chiliz price needs to close above $0.58.
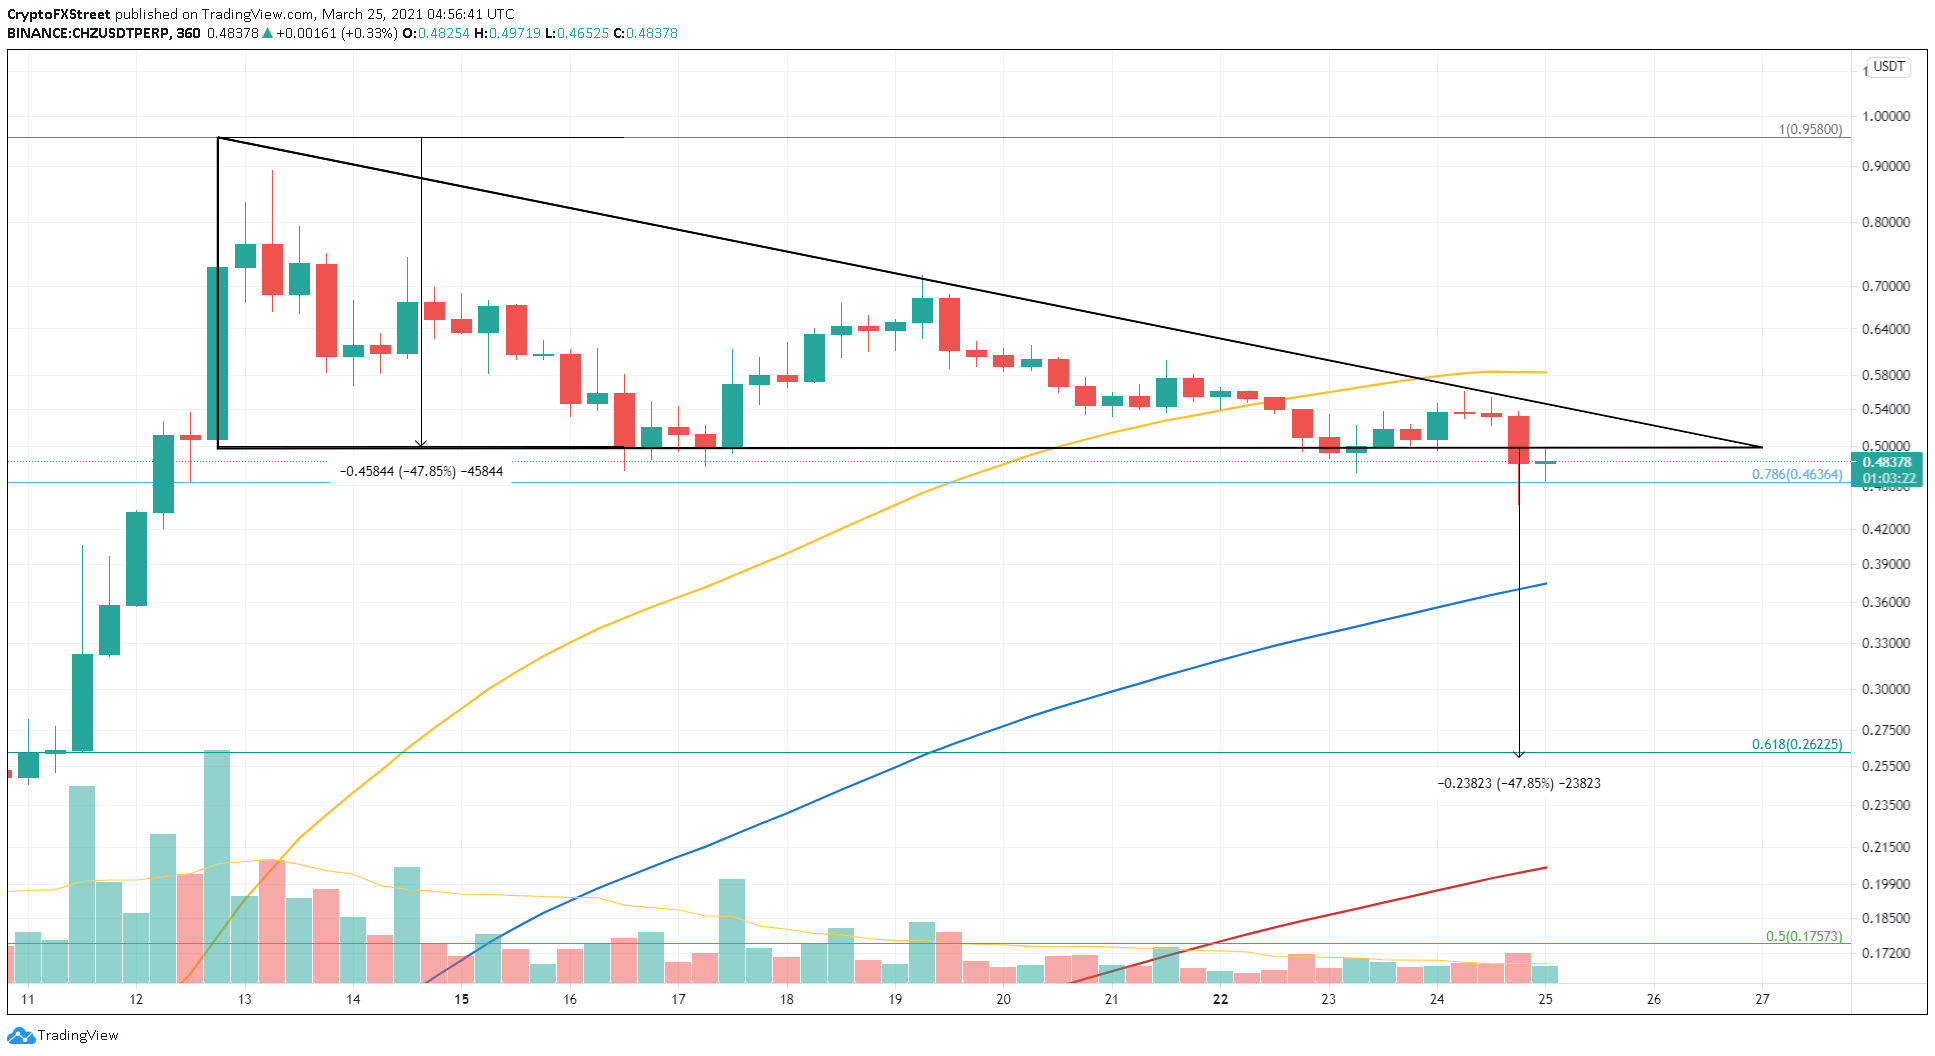
CHZ/USDT 6-hour chart
However, if bears triumph, then the target would be $0.26. A breakdown of this level could trigger a 20% retracement to the 200 Simple Moving Average (SMA) at $0.21 on the 6-hour chart.
Verasity price builds steam for 77% upswing
Verasity price surged nearly 340% in four days starting from March 12, forming a flag pole. Soon after hitting a local top at $0.02, the altcoin entered a consolidation that created the flag. During this phase, the VRA price formed a series of lower highs and lower lows, invoking a descending parallel channel.
This setup is a continuation pattern and forecasts a 77% upswing, which is the flag pole’s height added to the breakout point at $0.019. This target puts VRA at $0.034.
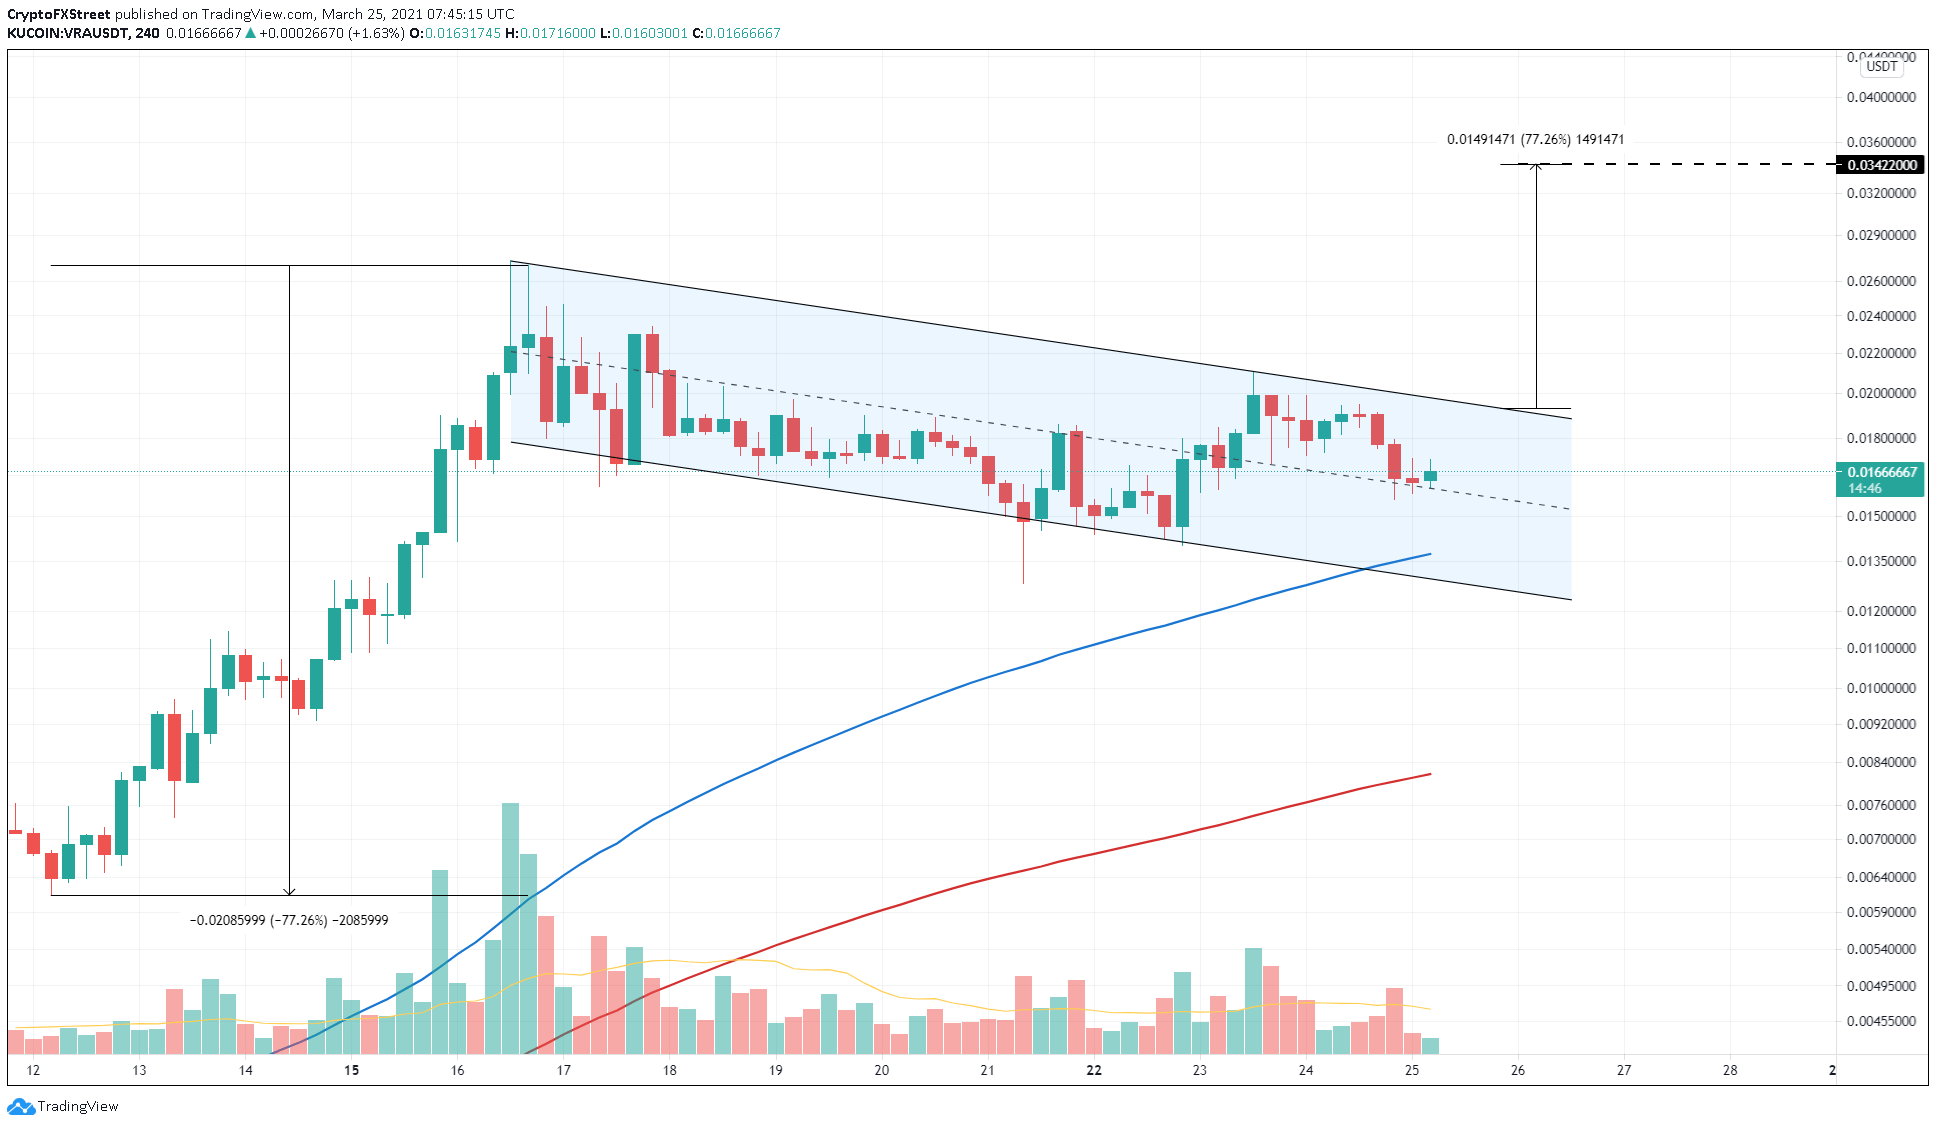
VRA/USDT 4-hour chart
In the case of a spike in selling pressure that leads to a decisive close below $0.01, the bullish outlook will be invalidated, kick-starting a descent for the Verasity price. If this comes to pass, VRA could drop 35% to 0.008.
Kelver price primed for a bullish spike
The Kelver price also revealed the formation of a continuation pattern known as a bullish pennant. KLV surged 620% between March 5 and March 11, forming a flag pole. Subsequently, the cryptocurrency consolidated into a pennant, where it created a series of lower highs and higher lows.
This technical formation forecasts an 86% upswing, which is the flag pole’s height added to the breakout point at $0.13. This target places KLV at $0.25.
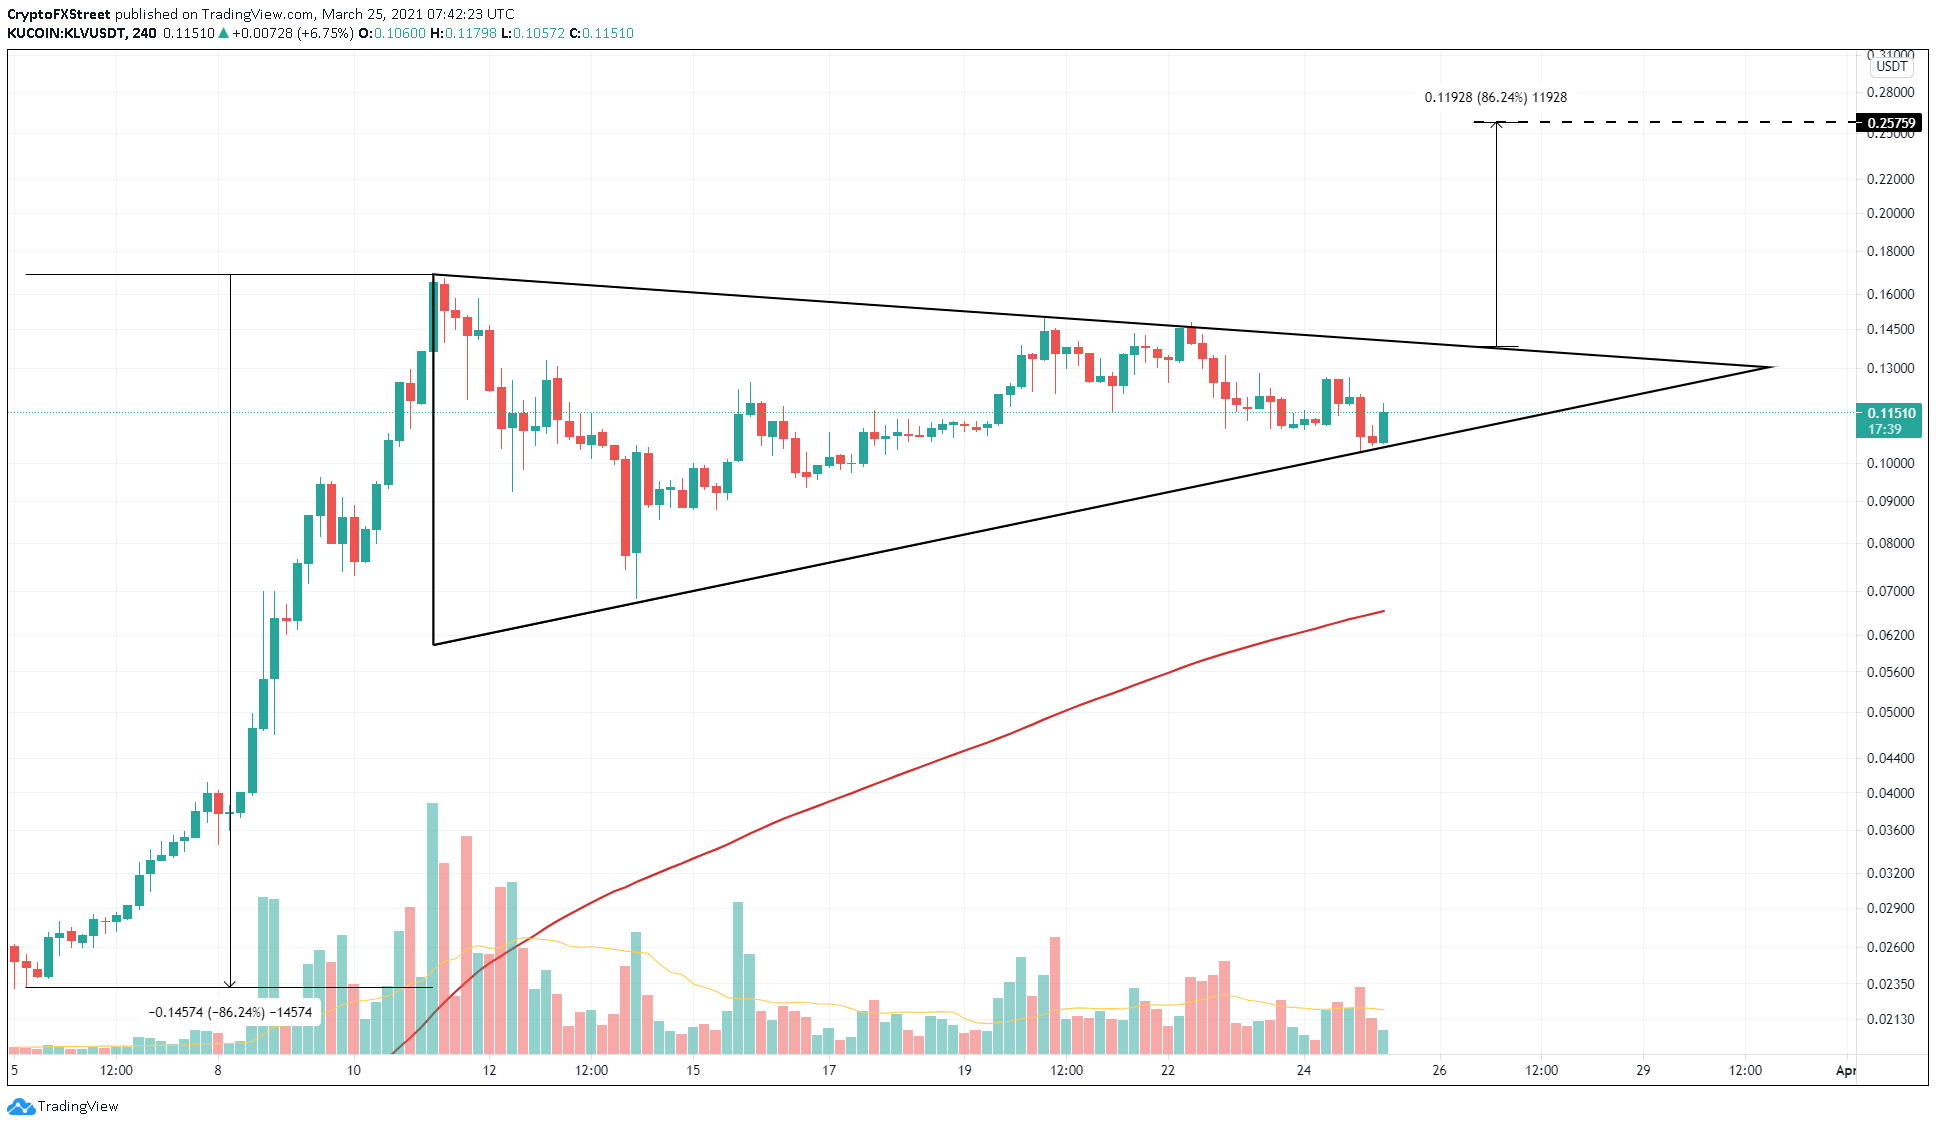
KLV/USDT 4-hour chart
If the Kelver price slides below the pennant’s lower trend line at $0.10, it will jeopardize the upward trajectory. Here, a spike in bearish pressure could trigger a 37% sell-off to $0.06, which coincides with the 200 four-hour Simple Moving Average (SMA).
Author

Akash Girimath
FXStreet
Akash Girimath is a Mechanical Engineer interested in the chaos of the financial markets. Trying to make sense of this convoluted yet fascinating space, he switched his engineering job to become a crypto reporter and analyst.


