These accurate indicators hint Ethereum price could bottom here, here’s what to expect next
- Ethereum price shows a potential bottom formation due to the development of bullish divergence on a daily time frame.
- A bounce from here could send ETH to $1,290 and $1,350 levels to collect buy-stop liquidity.
- Invalidation of the bullish outlook will occur after a daily candlestick close below $1,073

Ethereum price has been shedding since November and shows no signs of stopping as it revisits the November 9 swing lows. This development, while bearish, has produced signals that could hint at a local bottom formation and an incoming trend reversal.
Ethereum price hints at reversal
Ethereum price has dropped 36% from the November 4 swing high at $1,680. This massive downtrend created a bottom at $1,073 on November 9, which triggered a quick but ephemeral recovery to $1,350.
After setting up this local top at $1,350 and accumulating buy-stops above it, ETH followed Bitcoin and undid the recent gains. As a result, Ethereum price is hovering around the $1,073 local bottom, but things are different this time around.
The first and the most important buy signal for Ethereum price is provided by the Momentum Reversal Indicator (MRI), which has produced a green ‘one’ buy signal on the daily chart. This technical formation forecasts a one-to-four candlesticks upswing for ETH.
Over five months, the MRI presented eight reversal signals, and seven of them were spot on.
Adding credence to this bullish outlook is the bullish divergence seen between the Ethereum price and the Relative Strength Index (RSI). This setup occurs when price declines are not reflected in similar falls in the RSI, a popular momentum indicator. Such non-confirmation is usually a sign of weakening bearish momentum and suggests the start of a market reversal.
With two of these major bullish signs, investors need to be open to the possibility of a trend shift favoring bulls. A resurgence of buying pressure could propel Ethereum price to $1,195, a flip of this hurdle into a support level is crucial for ETH to revisit $1,290 and $1,350.
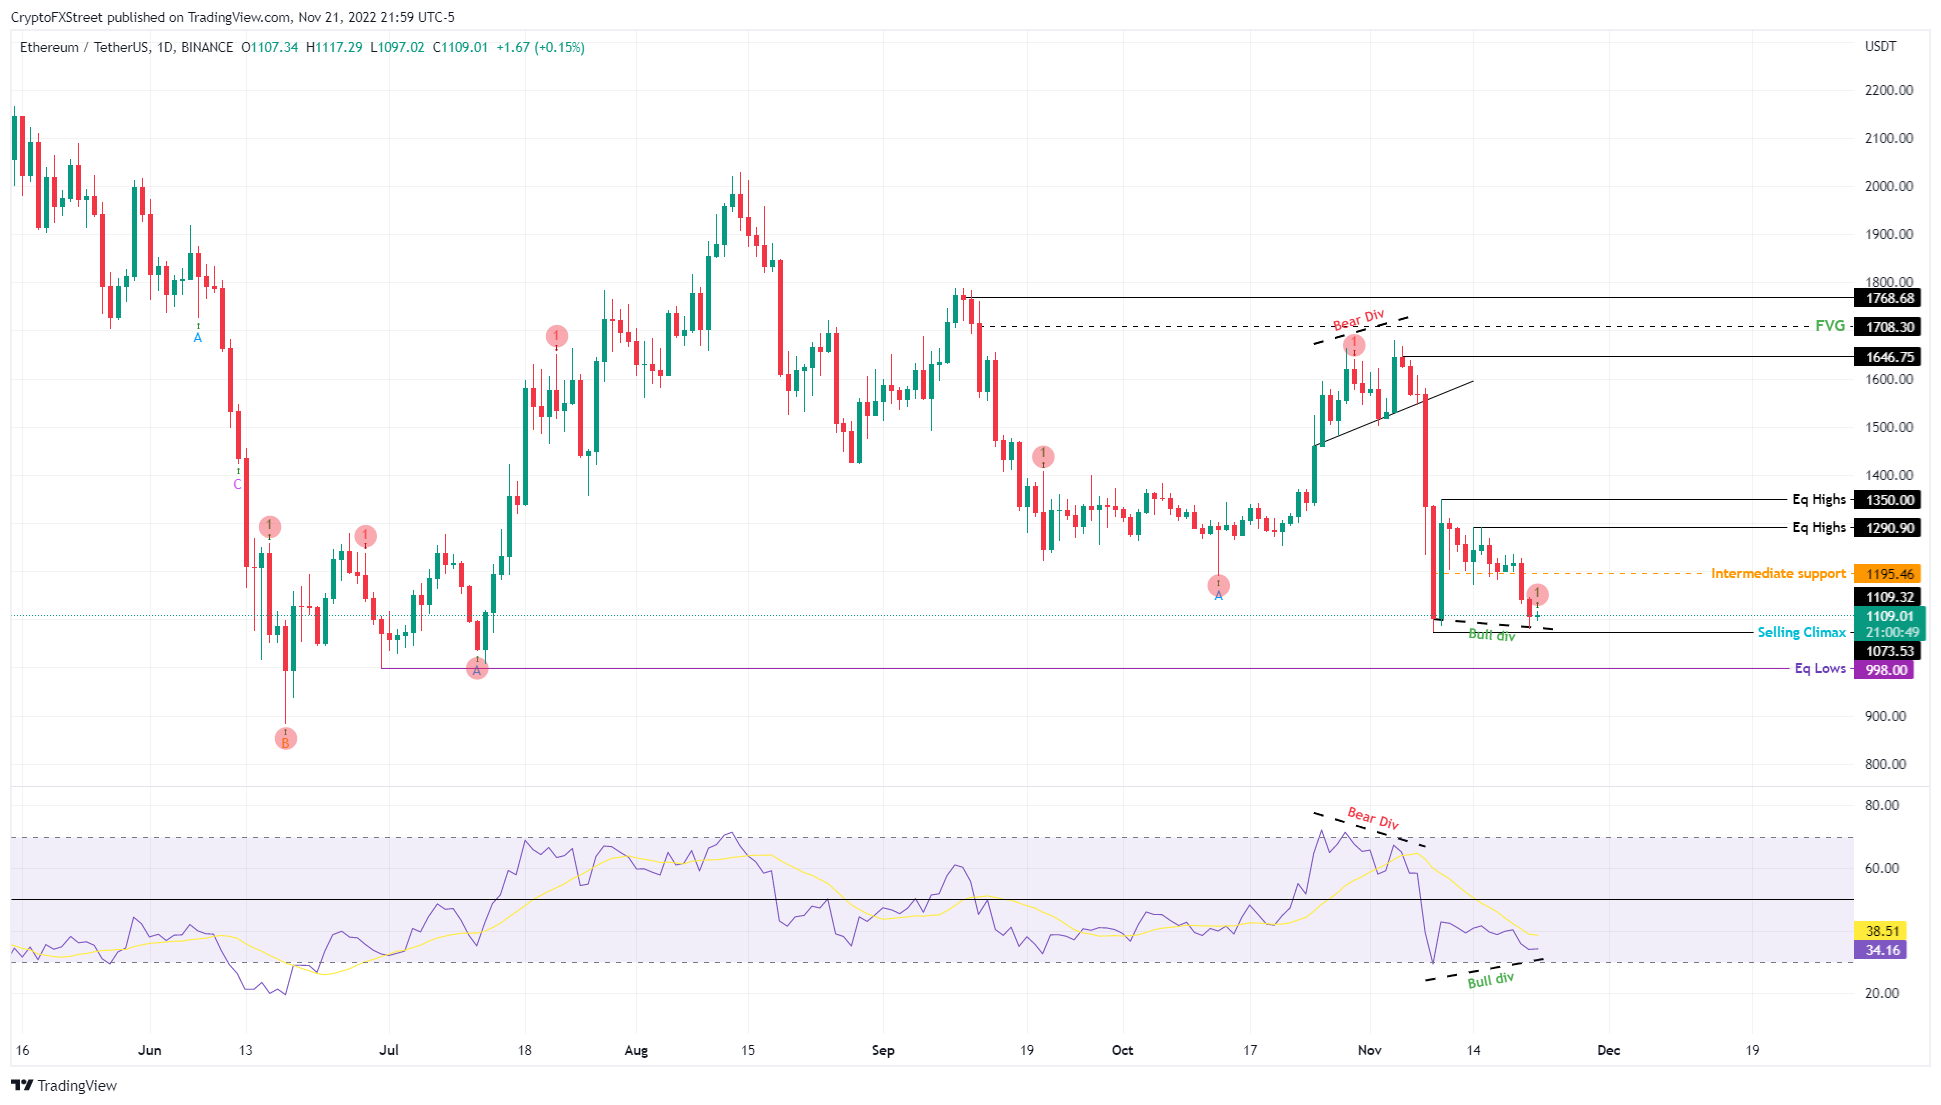
ETH/USDT 1-day chart
While the outlook for Ethereum price seems bullish, the bullish divergence seen on the daily chart is unconfirmed. Moreover, the uncertainty of the crypto market is at an alarming level with rumors about Genesis bankruptcy and FTX exploiter offloading his ETH in millions.
Hence, panicking investors could sell their holdings, triggering another sell-off for ETH. If Ethereum price produces a daily candlestick close below $1,073. It will invalidate the bullish thesis by producing a lower low.
In such a case, Ethereum price could crash 7% and sweep the equal lows at $994 and collect the sell-stop liquidity.
Author

Akash Girimath
FXStreet
Akash Girimath is a Mechanical Engineer interested in the chaos of the financial markets. Trying to make sense of this convoluted yet fascinating space, he switched his engineering job to become a crypto reporter and analyst.


