|

The Graph Price Forecast: GRT unstoppable 50% breakout is in play

  • The Graph price was contained inside a descending triangle pattern.
  • The digital asset has clearly broken out of the pattern which has a target of $2.8.
  • GRT faces weak resistance above $2.1 despite whales selling.

The Graph price had a significant 10% breakout from a key pattern on the 4-hour chart and aims for a long-term target of $2.8. There is barely any resistance above this point which means GRT will quickly rise.

The Graph price should quickly rise towards $2.8

On the 4-hour chart, GRT saw a significant breakout above a key resistance trendline part of the descending triangle pattern. The price target is all the way up at $2.8 as bulls have also reclaimed the 26-EMA support level. 

grt price

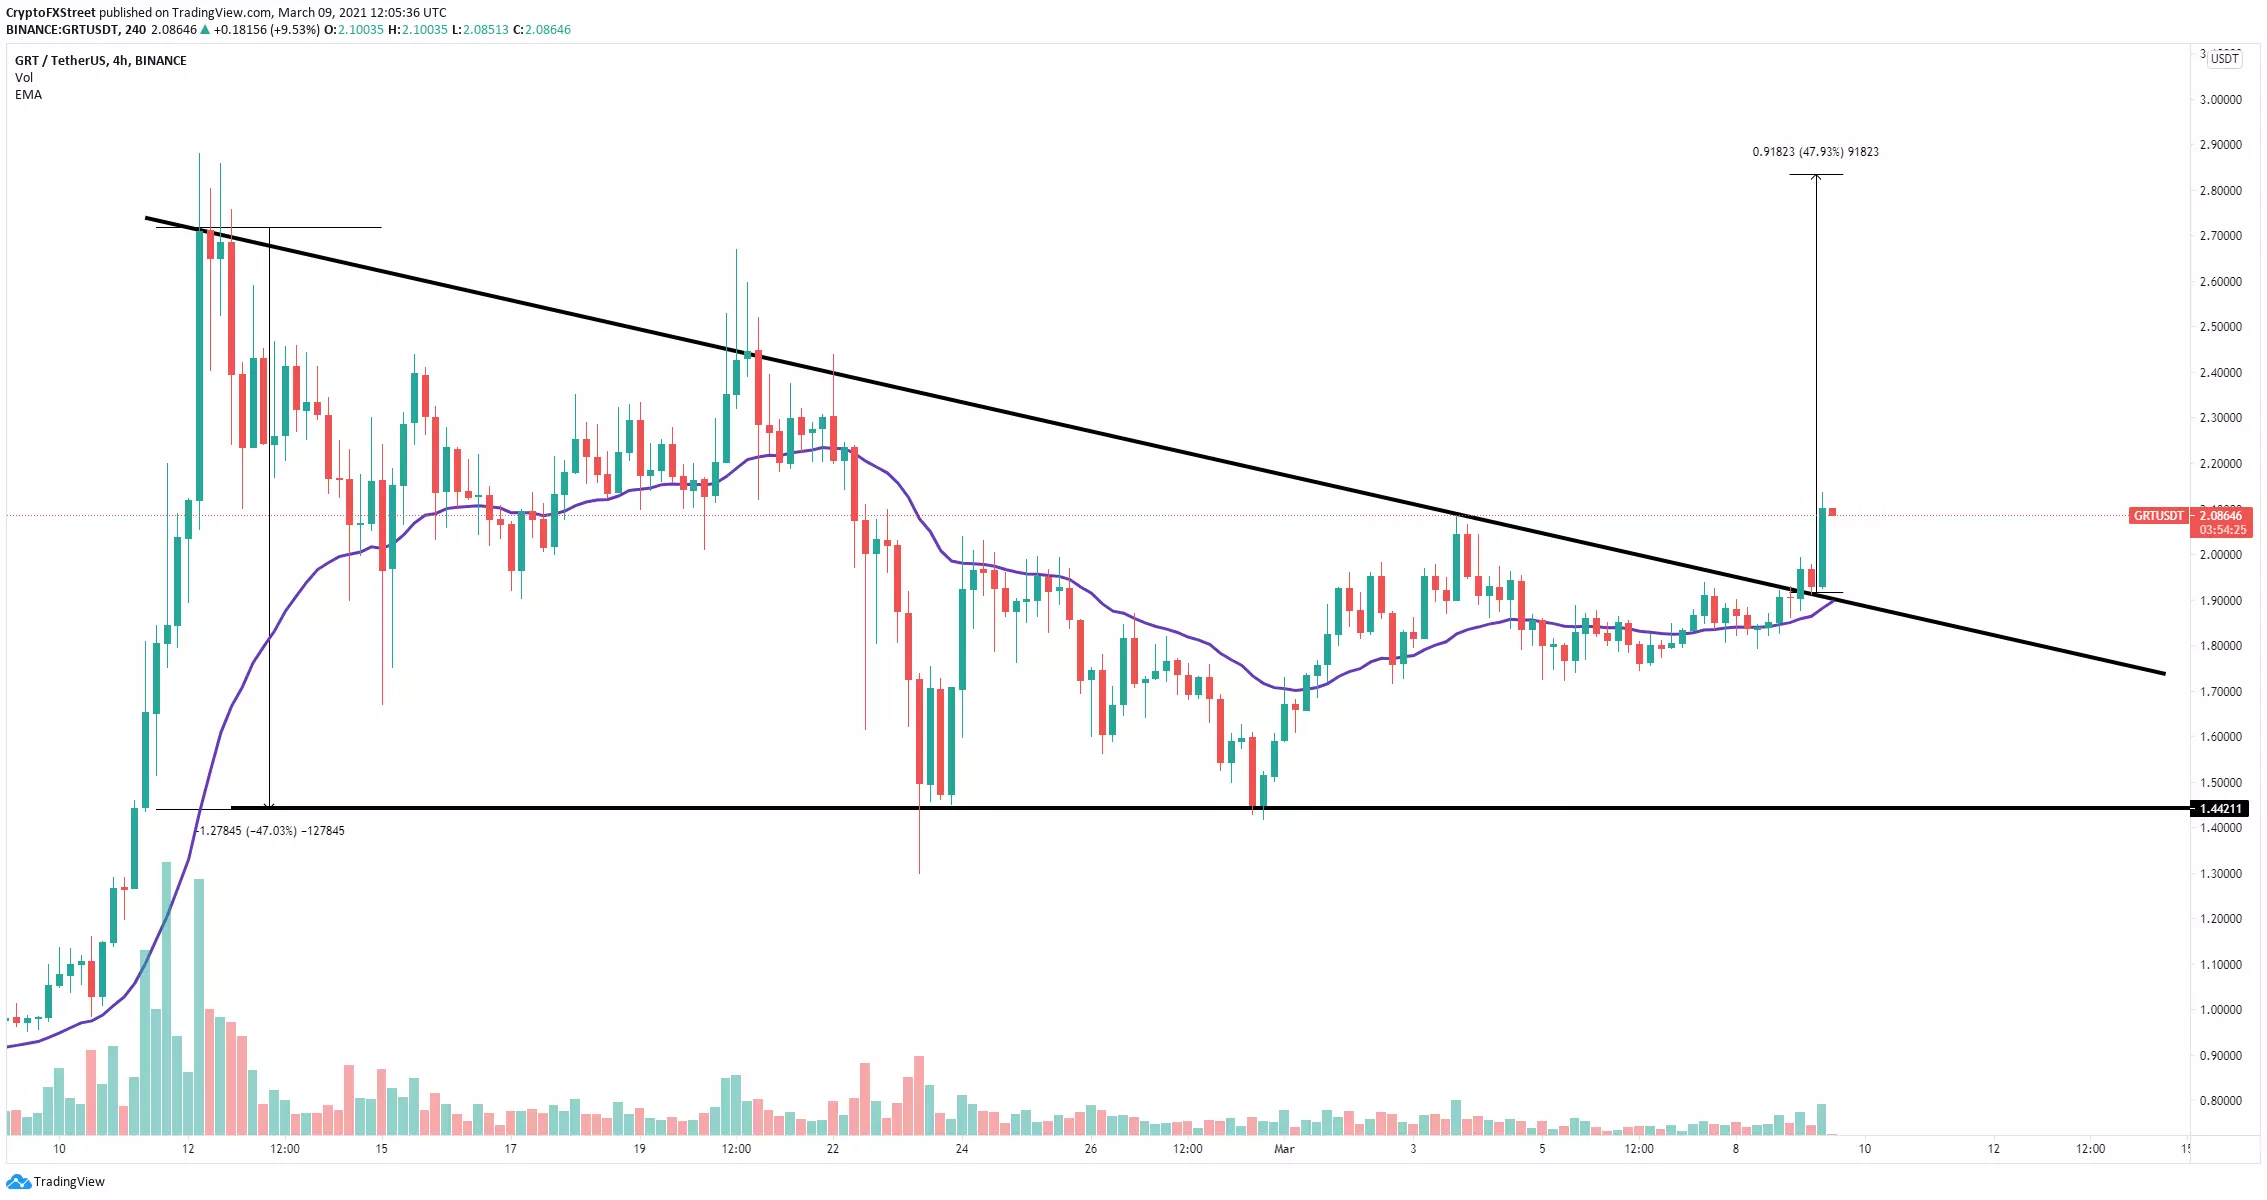
GRT/USD 4-hour chart

According to the In/Out of the Money Around Price (IOMAP) chart, there seems to be fairly weak resistance above $2.1. The most significant area is located between $2.3 and $2.36 where 1,330 addresses produced 32.68 million GRT in volume. 
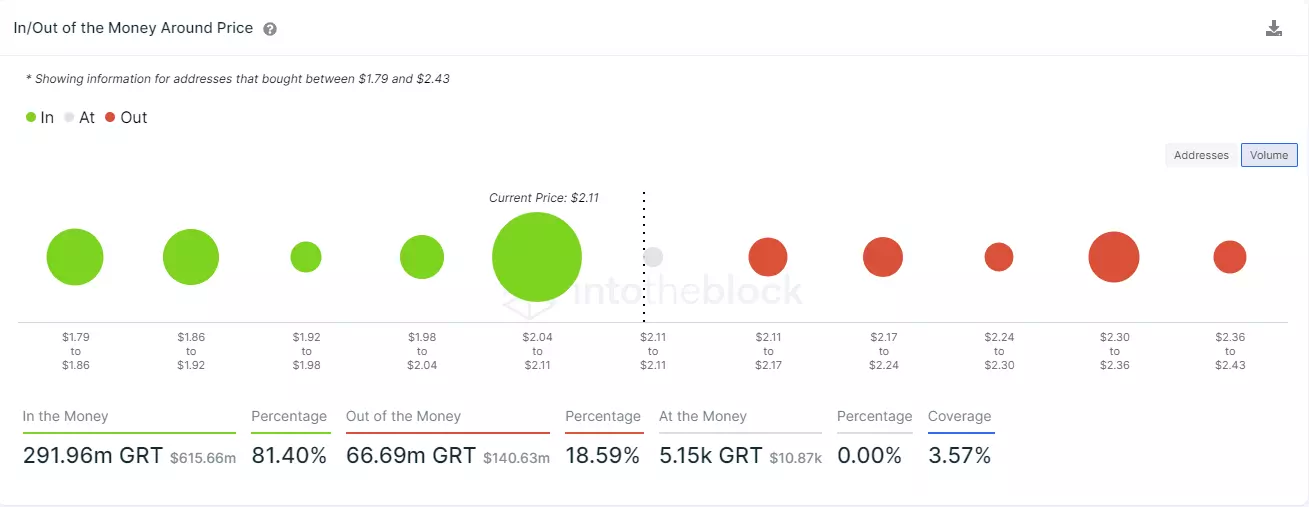
grt price

GRT IOMAP chart

The only concerning trend for GRT is the selling pressure coming on from whales. Since December 24, 2020, whales holding between 1,000,000 and 10,000,000 coins have been selling a lot. In the past week alone, the number of these large holders dropped by 13, which is significant. 

grt price

GRT Holders Distribution

This factor could drive The Graph price down to the previous resistance trendline, currently at $1.88 for a re-test.

Author

Lorenzo Stroe

Lorenzo Stroe

Independent Analyst

Lorenzo is an experienced Technical Analyst and Content Writer who has been working in the cryptocurrency industry since 2012. He also has a passion for trading.

More from Lorenzo Stroe
Share:

Editor's Picks

XRP pressured by weak ETF flows and declining retail interest

Ripple (XRP) is edging lower, trading above its intraday low of $1.32 at the time of writing on Tuesday. The decline from its weekly opening of $1.39 reflects heightened volatility in the broader cryptocurrency market, accentuated by tariff-triggered uncertainty.

Crypto Today: Bitcoin, Ethereum, XRP come under renewed pressure amid ETF outflows, tariff uncertainty

Bitcoin, Ethereum and Ripple are trading under increasing selling pressure at the time of writing on Tuesday, as market participants navigate renewed tariff uncertainty. The Crypto King holds above $63,000, down 2% intraday from its $64,656 open.

Bitcoin falls to two-week low as ETF outflows, tariff chaos weigh

Bitcoin price extends losses on Tuesday, ending a two-week consolidation phase. Risk-on sentiment fades amid growing uncertainty over Trump’s tariffs and rising US-Iran tensions, increasing downside risks toward $60,000.

Sui Price Forecast: SUI capitulates under pressure, opens the door to $0.70

Sui (SUI) declines by 3% at press time on Tuesday, extending the downside breakout of a short-consolidation range confirmed the previous day. Retail sentiment is bearish, as evidenced by increased long liquidations and a sharp drop in the funding rate. 

Bitcoin Price Annual Forecast: BTC holds long-term bullish structure heading into 2026

Bitcoin (BTC) is wrapping up 2025 as one of its most eventful years, defined by unprecedented institutional participation, major regulatory developments, and extreme price volatility.

Bitcoin: No recovery in sight

Bitcoin (BTC) price continues to trade within a range-bound zone, hovering around $67,000 at the time of writing on Friday, and falling slightly so far this week, with no signs of recovery.