The next Altcoin bottom will be painful, but the gains will be massive
- The total market capitalization of altcoins hit a high of $169 billion on September 1.
- The altcoin market is currently in a period of correction, trying to find the bottom.

While Bitcoin continues dominating, the altcoin market has lost around $23 billion in market cap during the past two months. The trading volume has declined significantly after a significant spike on September 12.
There seems to be an inverse correlation between Bitcoin’s dominance and the market capitalization of altcoins. The chart below shows that when BTC’s dominance goes down significantly, the market cap of altcoins rises and vice versa.
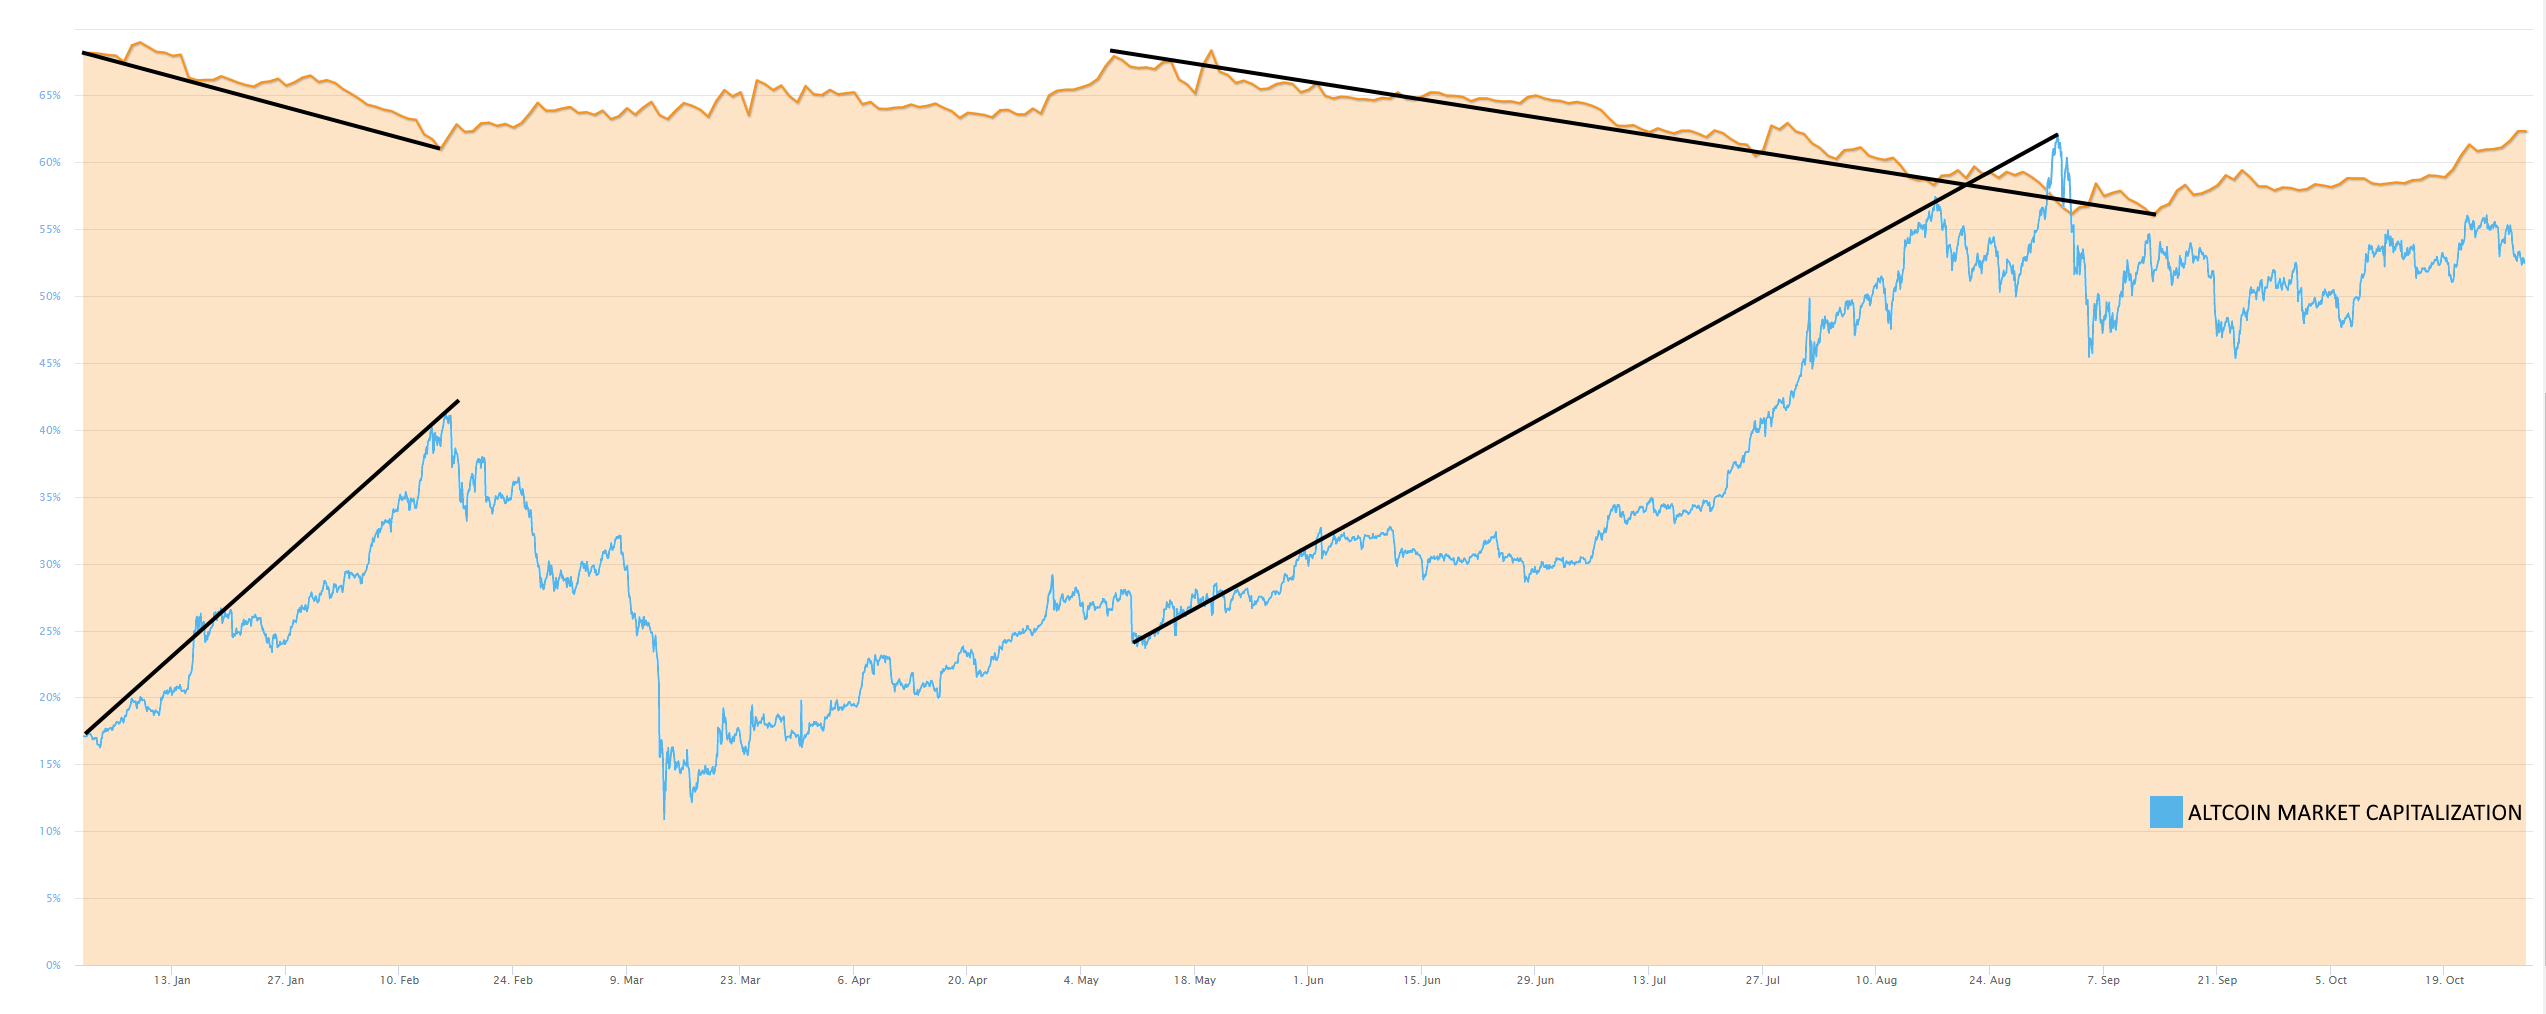
BTC dominance vs. altcoin market capitalization
Historical bottoms of popular altcoins
For the past two years, Ethereum has been trying to find a clear bottom. After the all-time high at $1,400 in January 2018, the digital asset plummeted down to $81, the first bottom. The digital asset then saw a massive 361% rally towards $364.
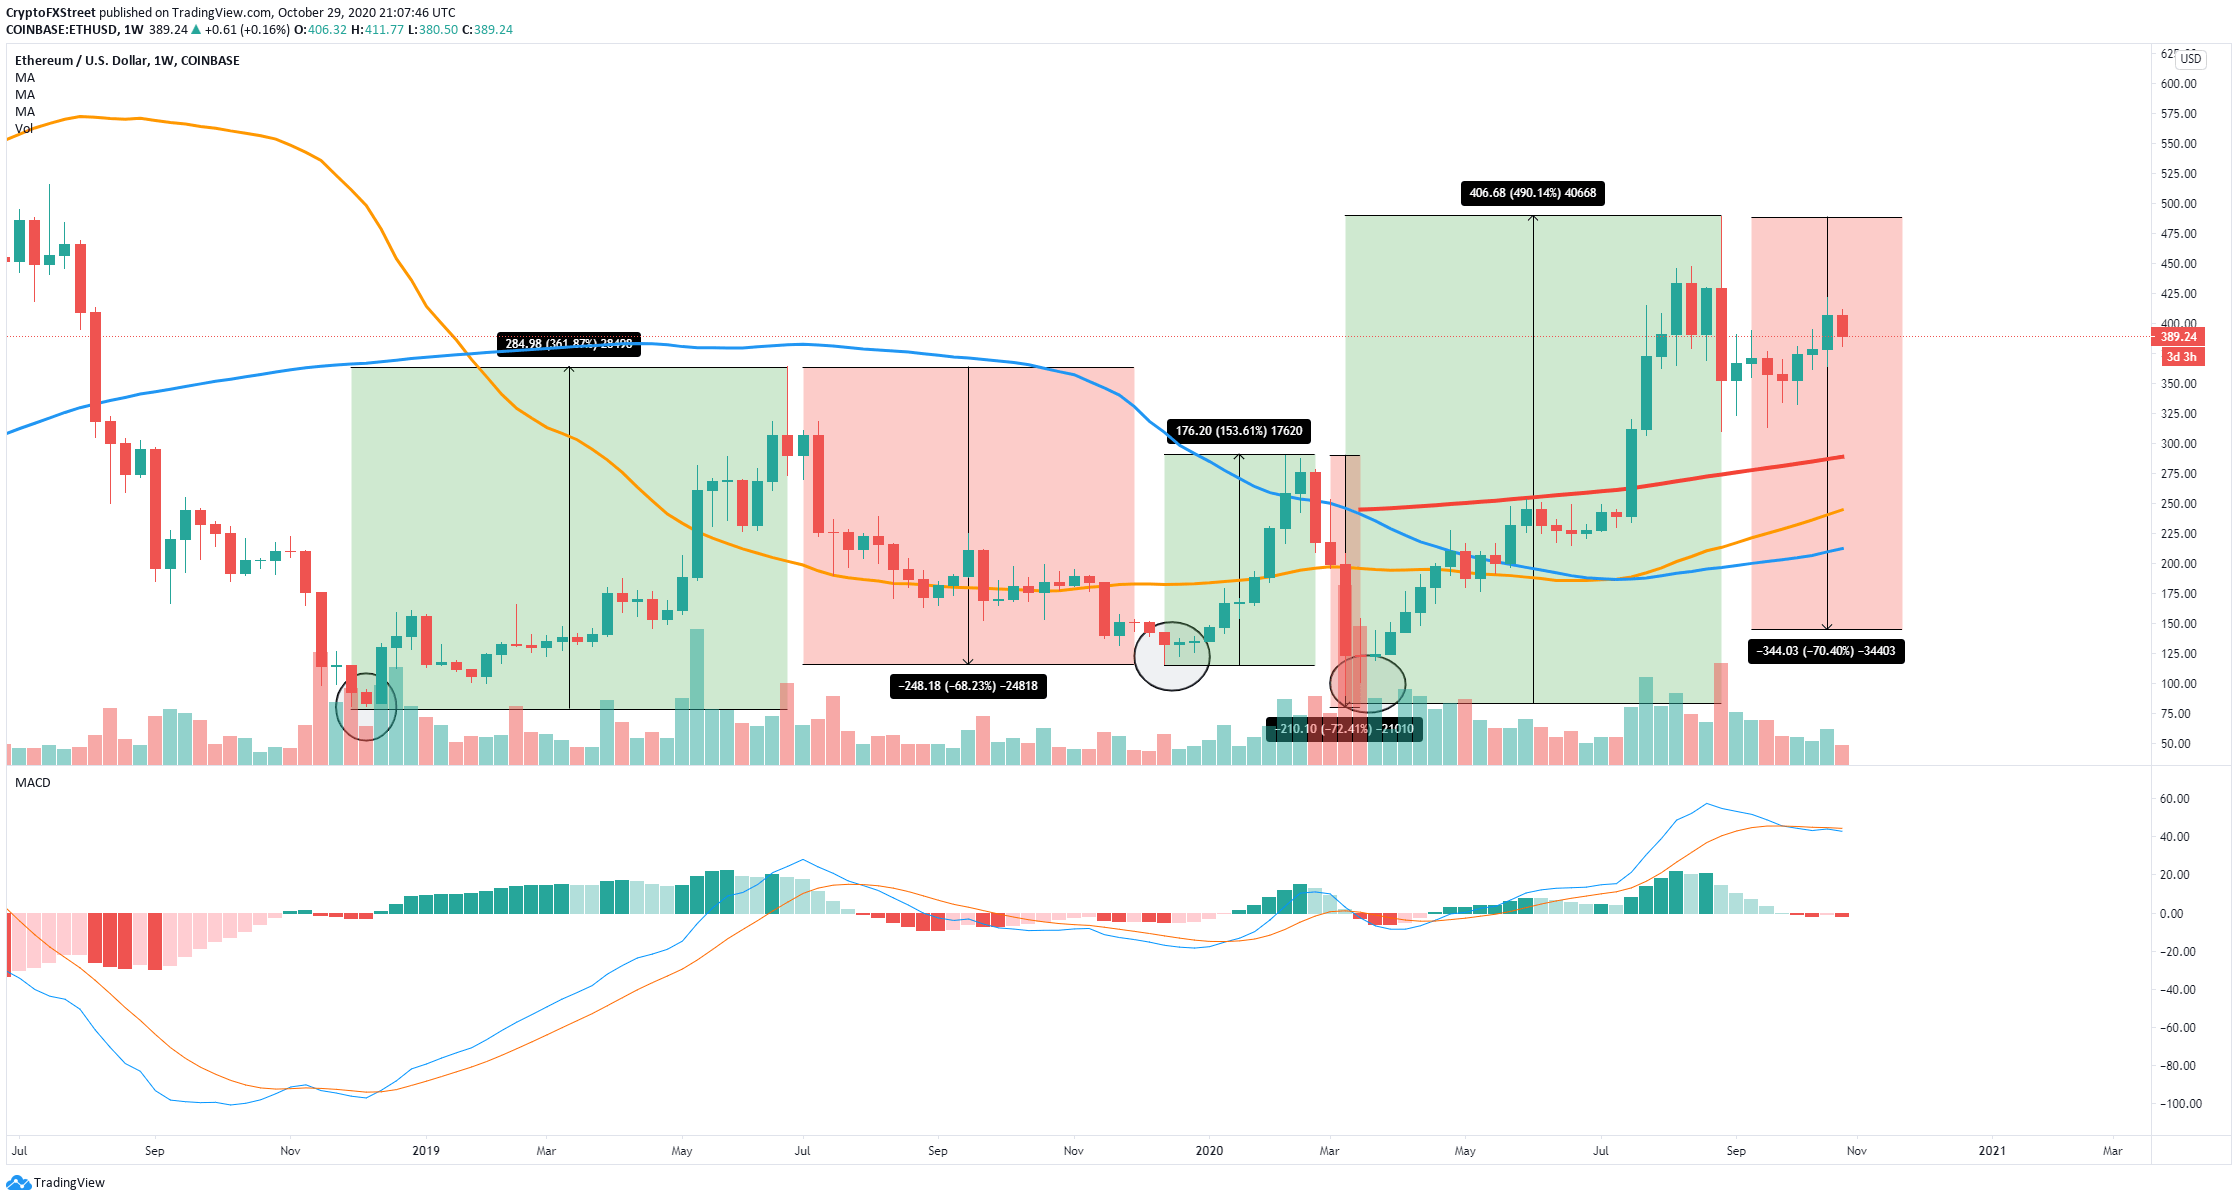
ETH/USD weekly chart
The weekly chart shows three bottoms, and significant follow up moves. The MACD has been quite accurate at predicting reversals in the past. Every time it turns bullish, the price of Ethereum rallies. Similarly, when it goes red, the price is likely to retrace, just like it’s happening now.
However, it’s important to notice that the last time the MACD turned bearish in March 2020, the pullback didn’t last longer than four weeks. The current pullback is already two months old, which means the bottom could have been established already at $300. If not, the likely price target would be $144.
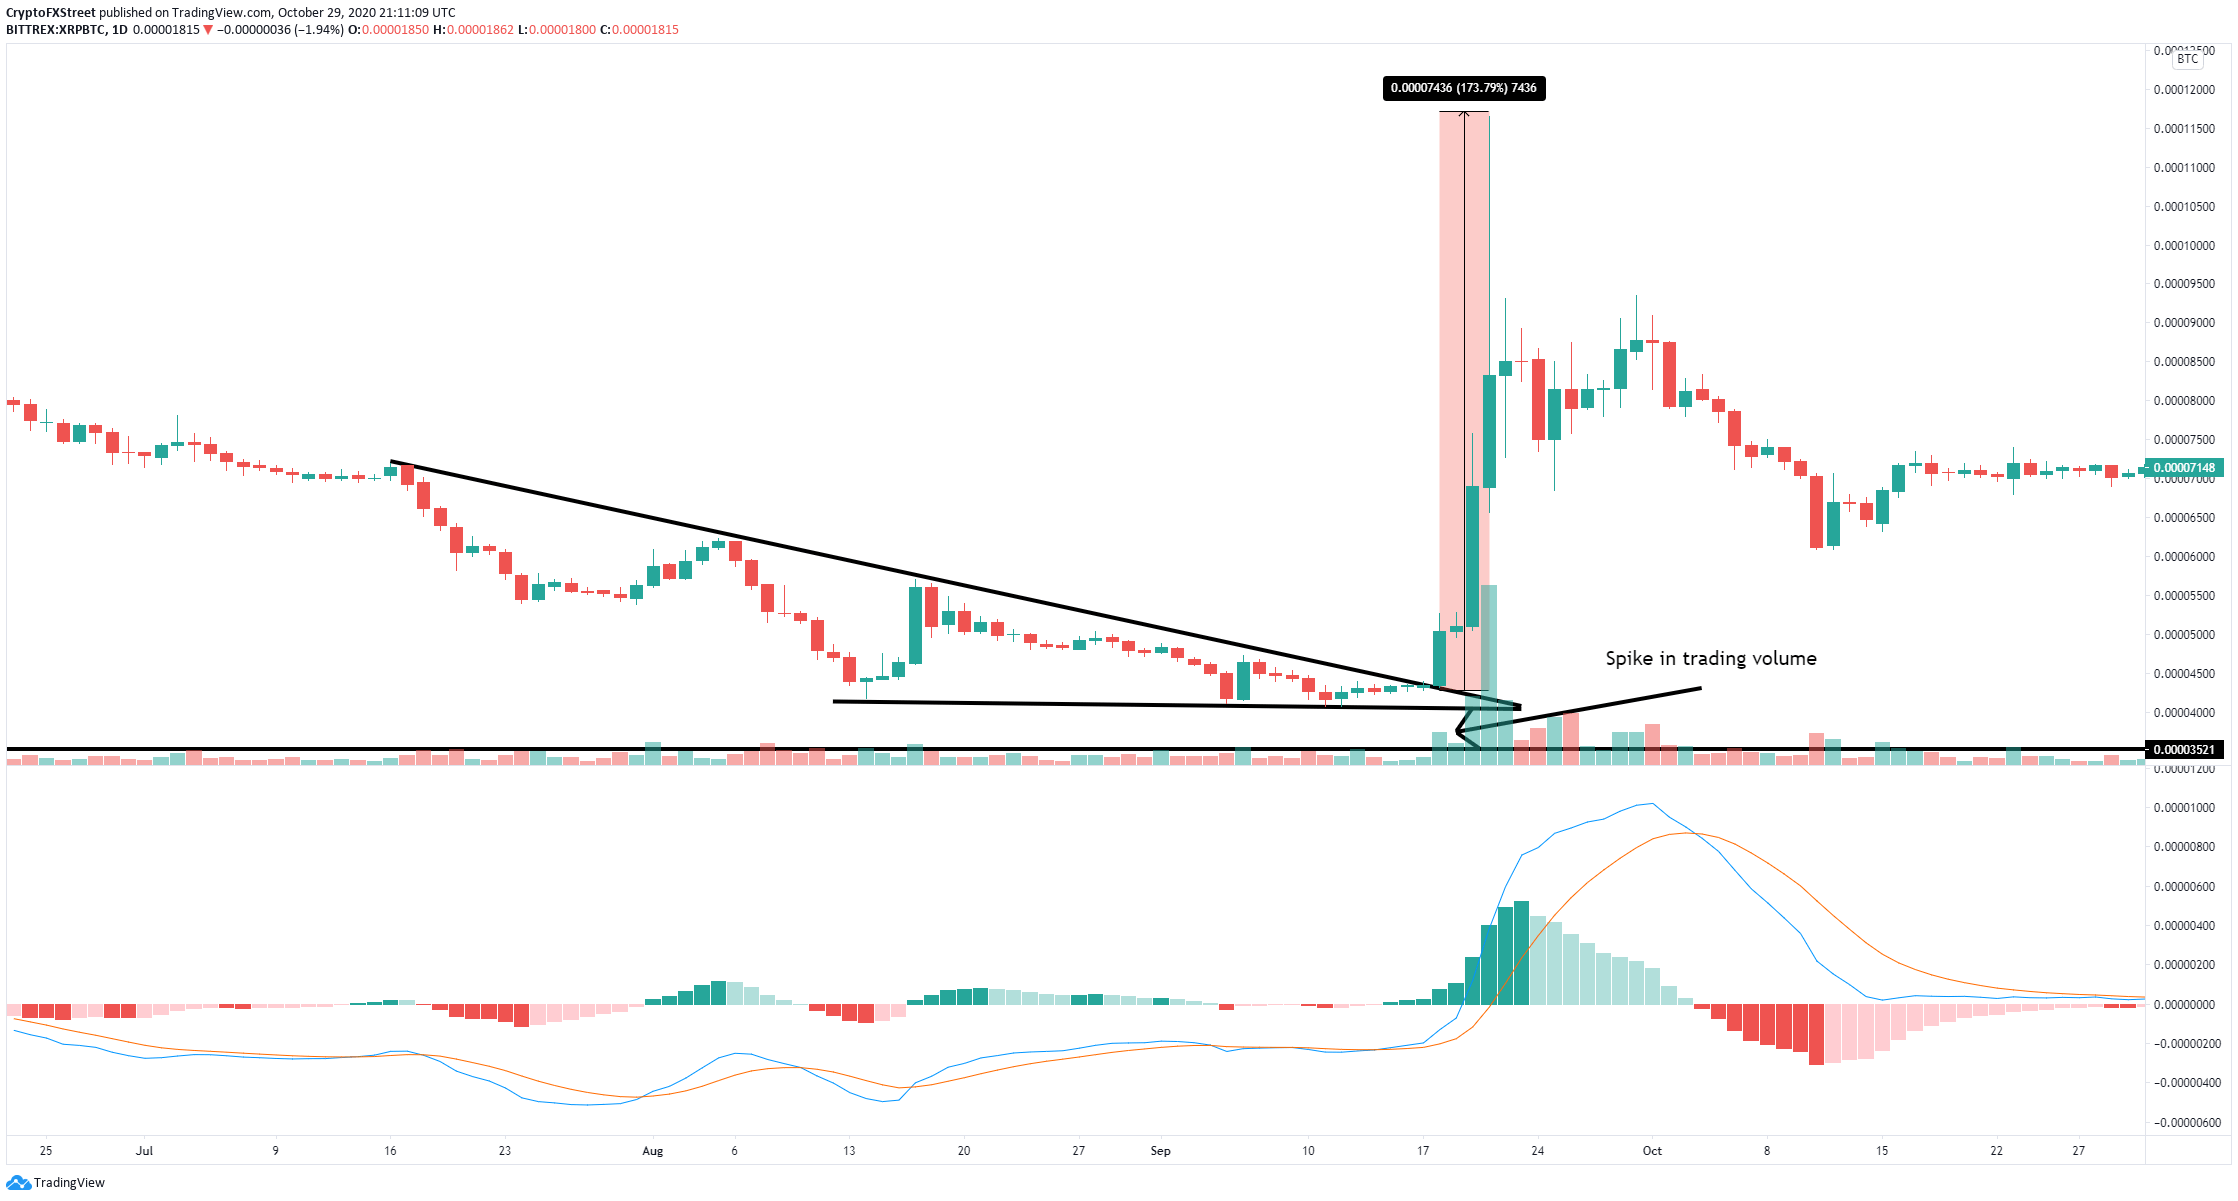
XRP/BTC weekly chart
XRP had a clear example of its bottom in September 2018 after an extended period of consolidation. After establishing several lows, close to each other, the digital asset saw a breakout of a descending triangle with increasing trading volume, which seems to be one of the most significant indicators.
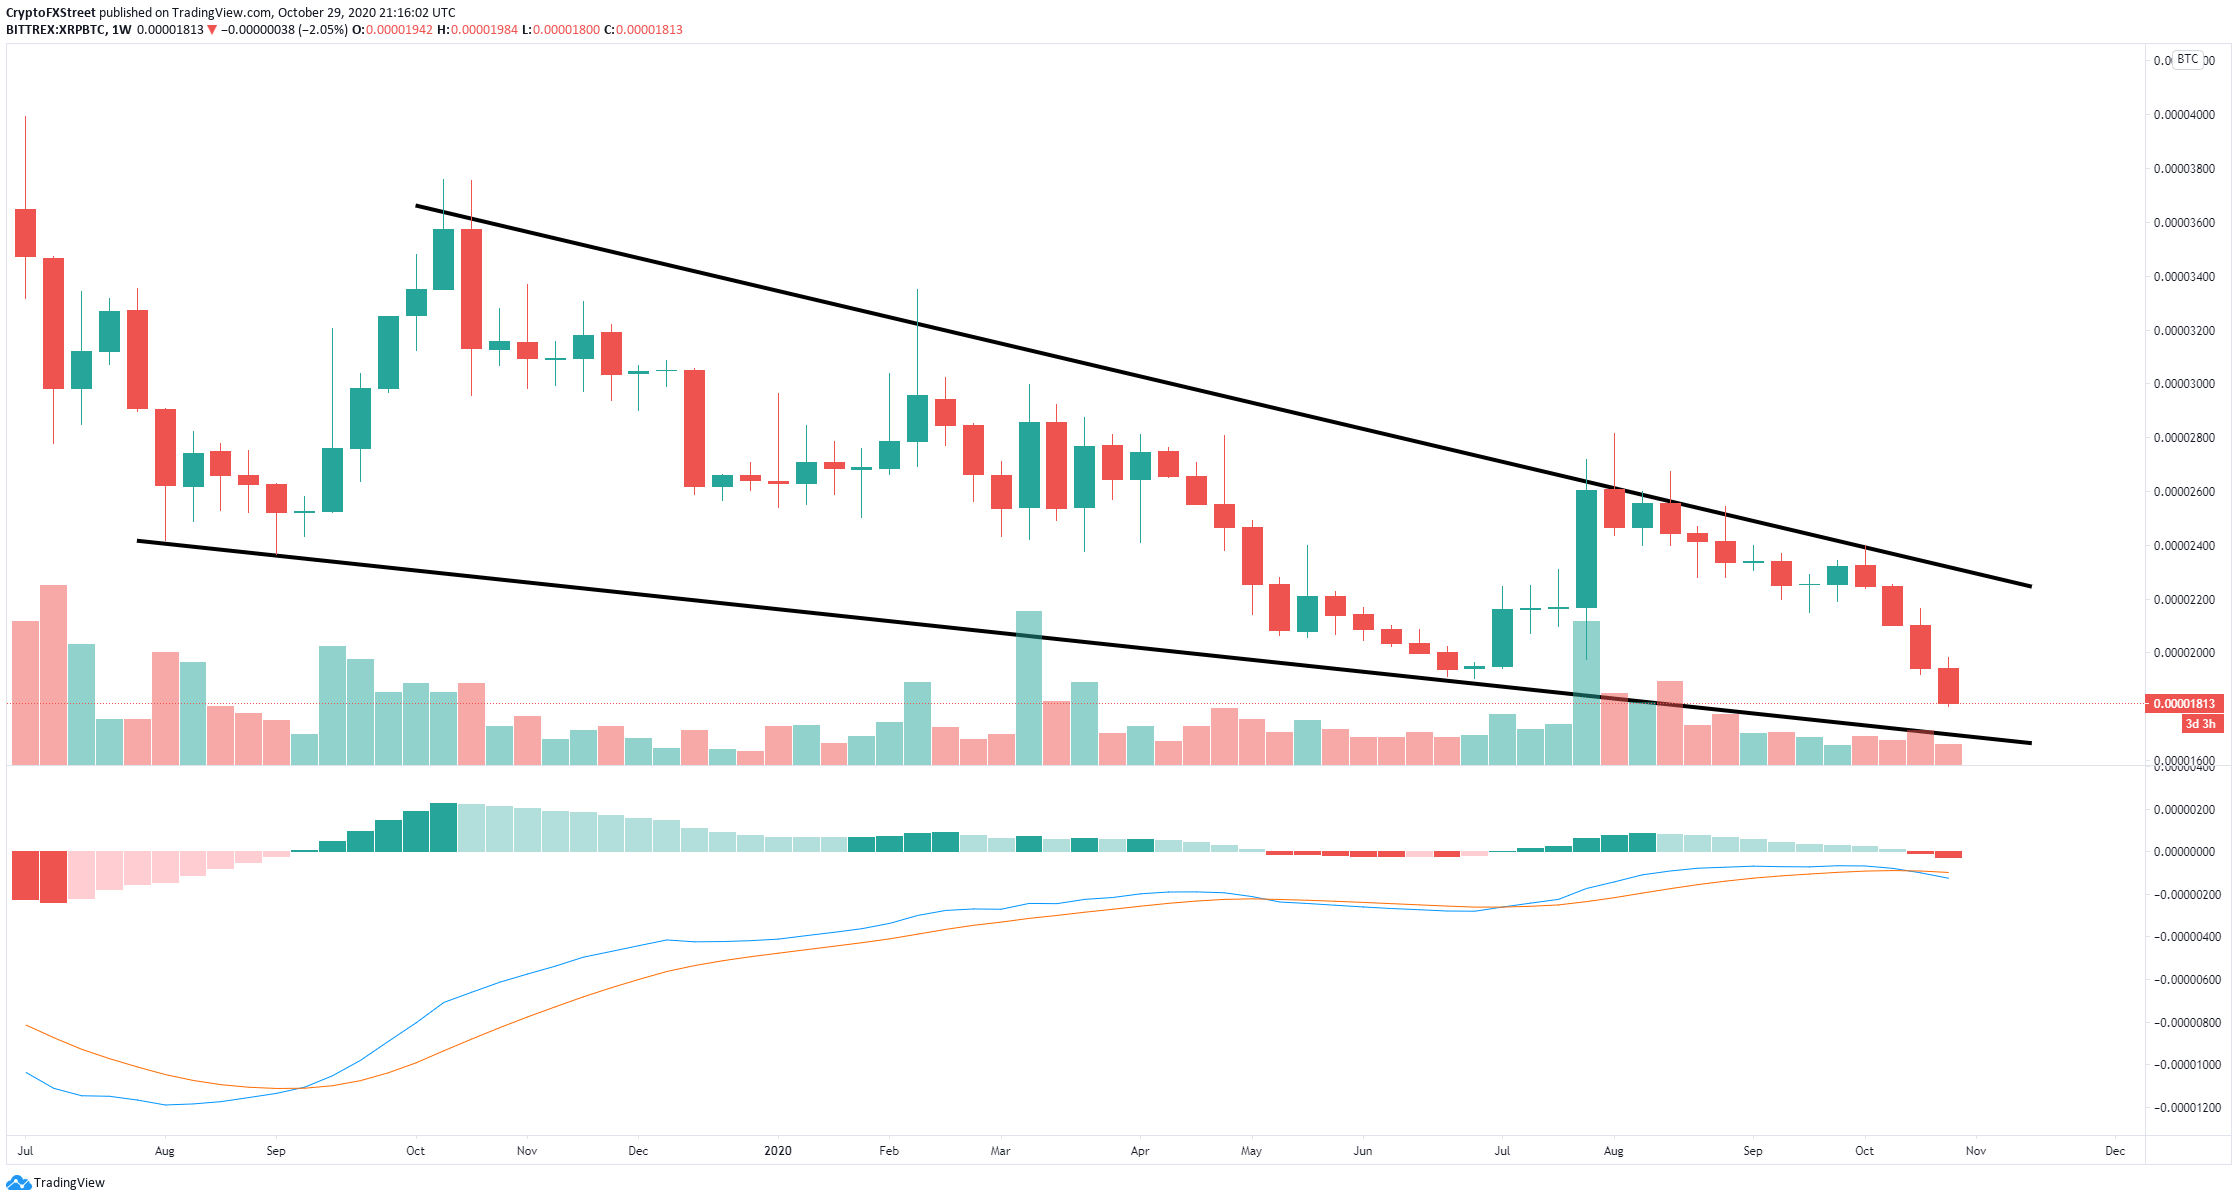
XRP/BTC weekly chart
Currently, the digital asset is bounded inside a descending wedge pattern formed on the weekly chart. So far, a few spikes in volume can be seen in March 2020 and July 27. A breakout of this pattern with increasing trading volume would most likely confirm the bottom for XRP, as it happened in the past.
Author

Lorenzo Stroe
Independent Analyst
Lorenzo is an experienced Technical Analyst and Content Writer who has been working in the cryptocurrency industry since 2012. He also has a passion for trading.


