The Mask Network set to outperform its Metaverse peers again with 40% rally in March
- The Mask Network is clinging onto gains again after two negative downbeat trading days.
- MASK is set to break back above the trend channel first, as the Fed Minutes did not hold any surprises.
- Next up is the longer-term red descending trend line for a breakout trade.
The Mask Network (MASK) could not enjoy the positive influence and tailwind created by its successful hackathon earlier this week. Instead, MASK had to give up over 7% of its value before support could be found. That support comes from the monthly pivot, as well as the lower bound of the trend channel just a few cents lower, and now could see MASK swinging back up for a breakout trade.
The Mask Network sees delayed effects kicking in
The Mask Network is set to pair back its losses for the week and could be flirting with closing this week on a high note. The big hackathon did not have the desired positive influence as first thought. It was only after the publication of the US Fed Minutes that traders started buying into the price action that currently results in a 1.5% gain in European trading hours.
MASK will see more continuation of this rally as the support area has been doing a perfect job in undergirding the price action. First up will be the upper band of the trend channel near $4.50 to test and break out. Once that is done, probably sometime in March, the red descending trend line will be the one to watch as a breakout would see a massive bullish explosion.
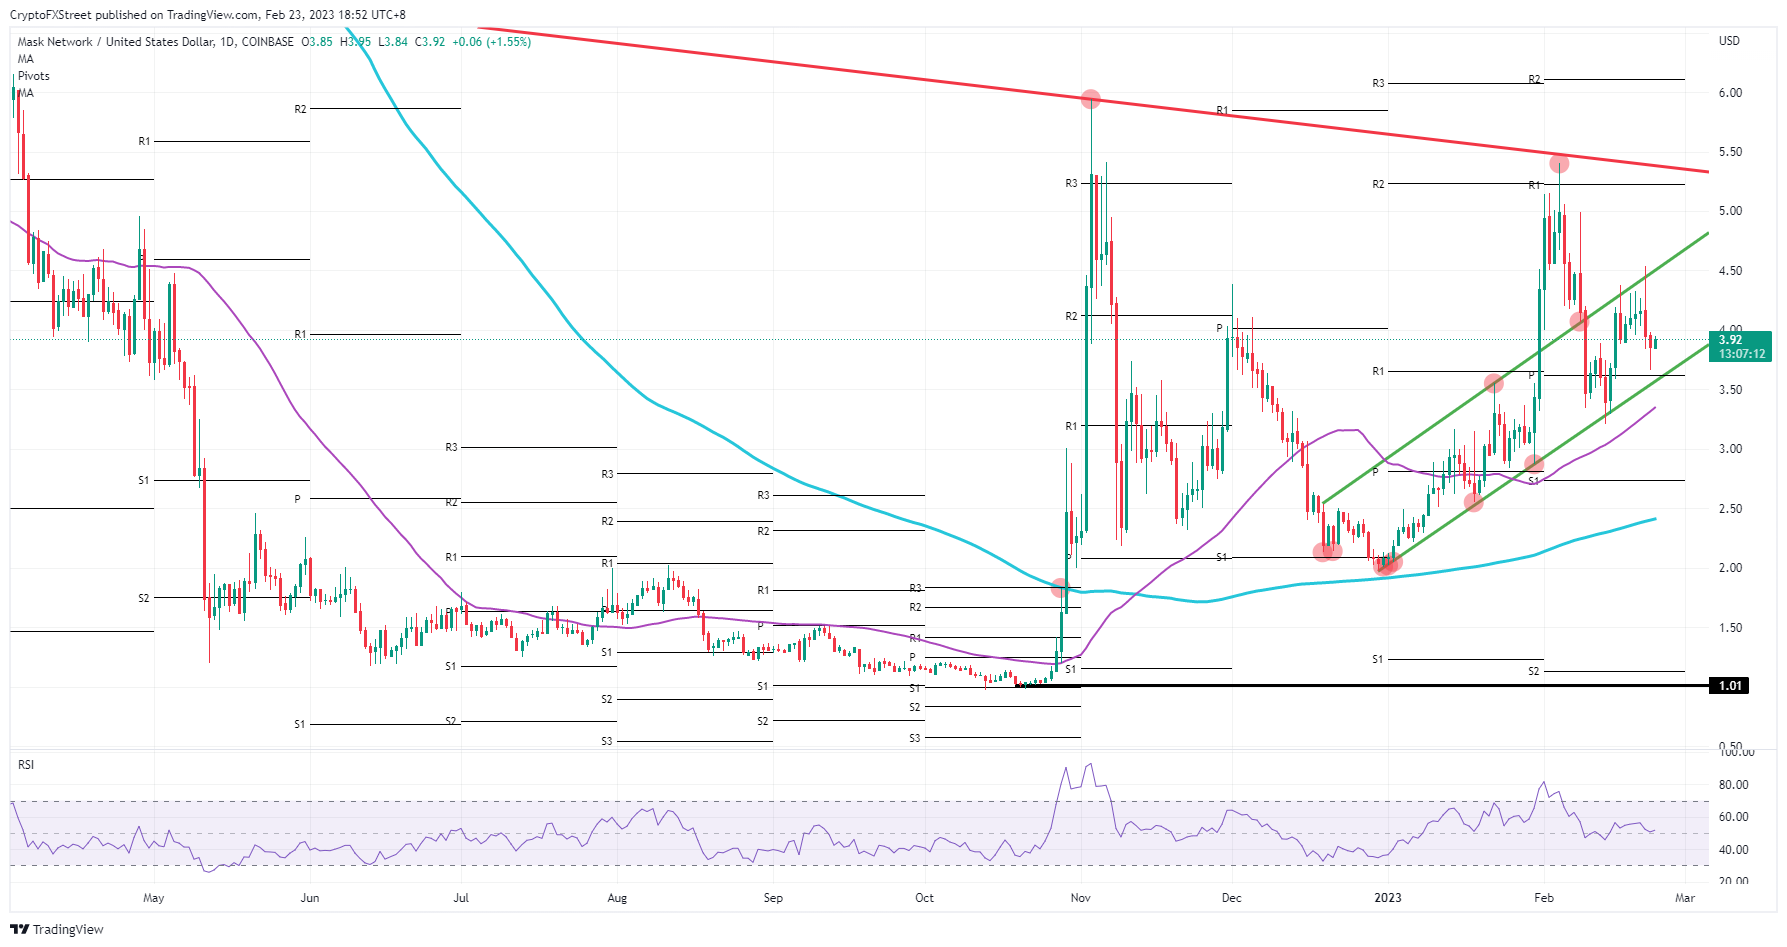
MASK/USD daily chart
The big line in the sand here is the monthly pivot for February and the green ascending trend line at the lower band. Once those start to fall apart, a tiered dropdown will unfold. First up is $3.50 with the 55-day Simple Moving Average, and next is the $2.73 level, where the monthly S1 support level will be ready to catch any falling knives.
Author

Filip Lagaart
FXStreet
Filip Lagaart is a former sales/trader with over 15 years of financial markets expertise under its belt.


