The Graph Price Prediction: GRT's 600% rally unstoppable as bulls eye upswing to $5
- The Graph's uptrend is supported by a positive network growth, according to data by IntoTheBlock.
- The MACD validates GRT's relentless fight for gains targeting $0.5 on the 12-hour chart.
- A sell signal on the 12-hour chart may sabotage the upswing to $5 is validated.

In the last six weeks, the Graph has rallied more than 600% from $3.35 to the prevailing market value of $2.2. Breaking above the former all-time high in 2020 at $0.74 triggered massive buy orders, culminating in the upswing. Meanwhile, the crypto has remained on the upward trajectory, hinting at a possible rally to $5.
The Graph lifts off into space targeting the moon
GRT is dancing at $2.26 at the time of writing amid a persistent push from buyers to catapult it to higher highs. This token seems to have a massive bullish impulse, especially with the Moving Average Convergence Divergence (MACD) moving higher in the positive territory. Moreover, the bullish divergence the MACD line (blue) has made above the signal line is a bullish signal that the uptrend will continue in the near term.
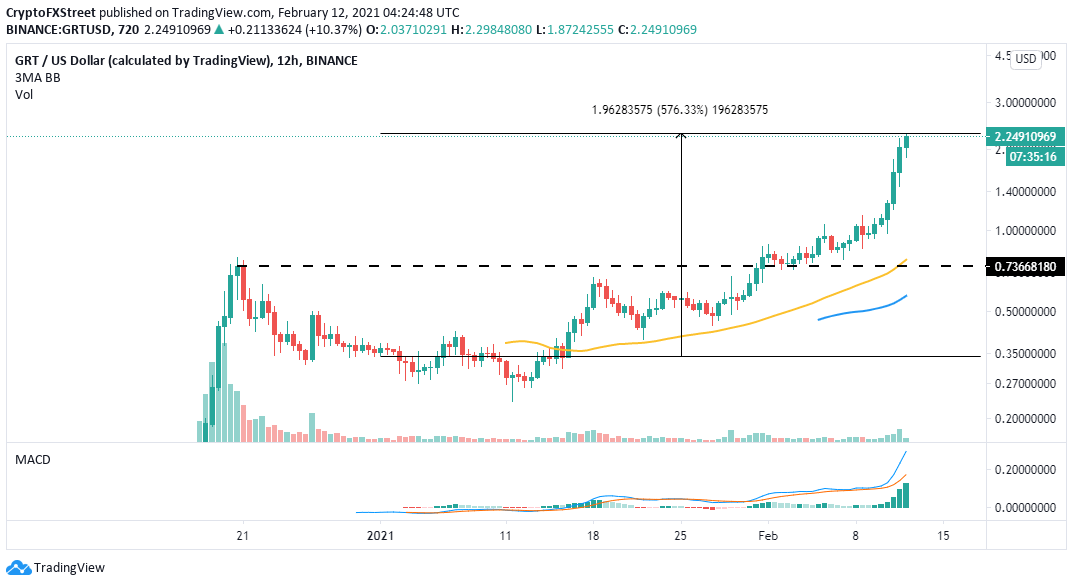
GRT/USD 12-hour chart
IntoTheBlock's "Daily New Addresses" metric reveals that The Graph has a positive network growth. An increase in the number of unique addresses has been printed since the beginning of February. The last few days have been particularly significant.
A surge in the new addresses joining the network has always been a bullish signal for both the project and the token's future value. Therefore, GRT has the potential to complete the leg up to $5 as long as network growth remains positive.
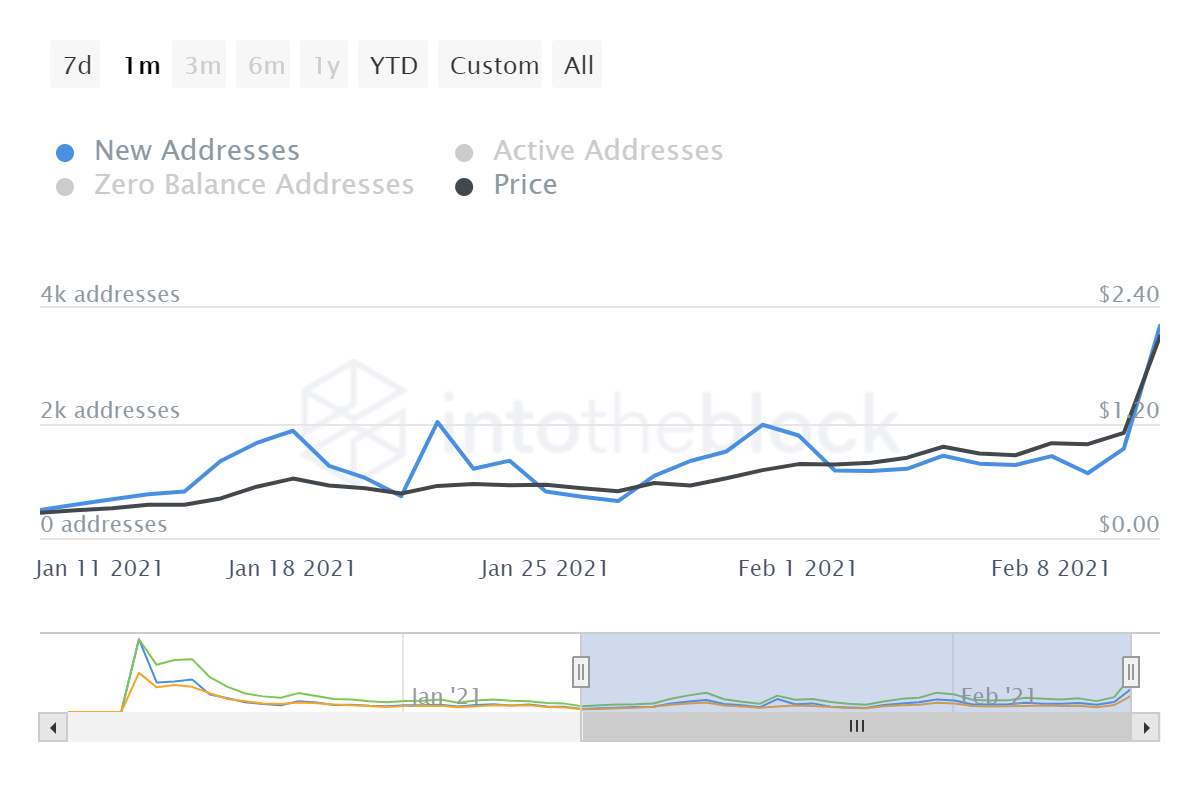
The Graph number of new addresses
Looking at the other side of the fence
Despite the rally being witnessed, GRT whales are disposing at a fast rate. Santiment's holder distribution shows that addresses holding between 1 million and 10 million GRT have decreased from 71 on January 28 to 58 on February 12, representing an 18% drop. In other words, the selling pressure is growing and may sabotage the anticipated upswing toward $5.
%20[07.51.45,%2012%20Feb,%202021]-637487037505819677.png)
The Graph holder distribution
Similarly, a sell signal on the 12-hour chart may validate the bearish outlook. This call to sell took the form of a green nine candlestick. It is confirmed when its low closes the day below the previous sixth and seventh candles.
-637487037805225174.png)
GRT/USD 12-hour chart
A reversal from the current price levels may see The Graph drop in one to four 12-hour candlesticks. The bearish leg may seek support at $1 and the 50 Simple Moving Average near $0.74.
Author

John Isige
FXStreet
John Isige is a seasoned cryptocurrency journalist and markets analyst committed to delivering high-quality, actionable insights tailored to traders, investors, and crypto enthusiasts. He enjoys deep dives into emerging Web3 tren


