|

The Graph price has more room to go down despite 40% drop

  • GRT price might struggle to stay above $0.5 as technicals turn bearish.
  • A recent report by Santiment indicates The Graph could be poised for a deeper correction.

The Graph has been one of the best-performing assets in the past month after getting immediately listed on Binance and Coinbase. The digital asset managed to quickly climb towards a $1 billion market capitalization in just three days. 

GRT price finally undergoes an inevitable correction

According to Santiment, the word grt was the highest trending on social media, way above Elon Musk and other coins. It’s often the case that when this metric is at its highest, the digital asset suffers a correction.

So this was a top for GRT. It could be a temporary top. Just keep in mind the power of the crowd is when everyone is talking about a token. Market goes opposite.
grt price

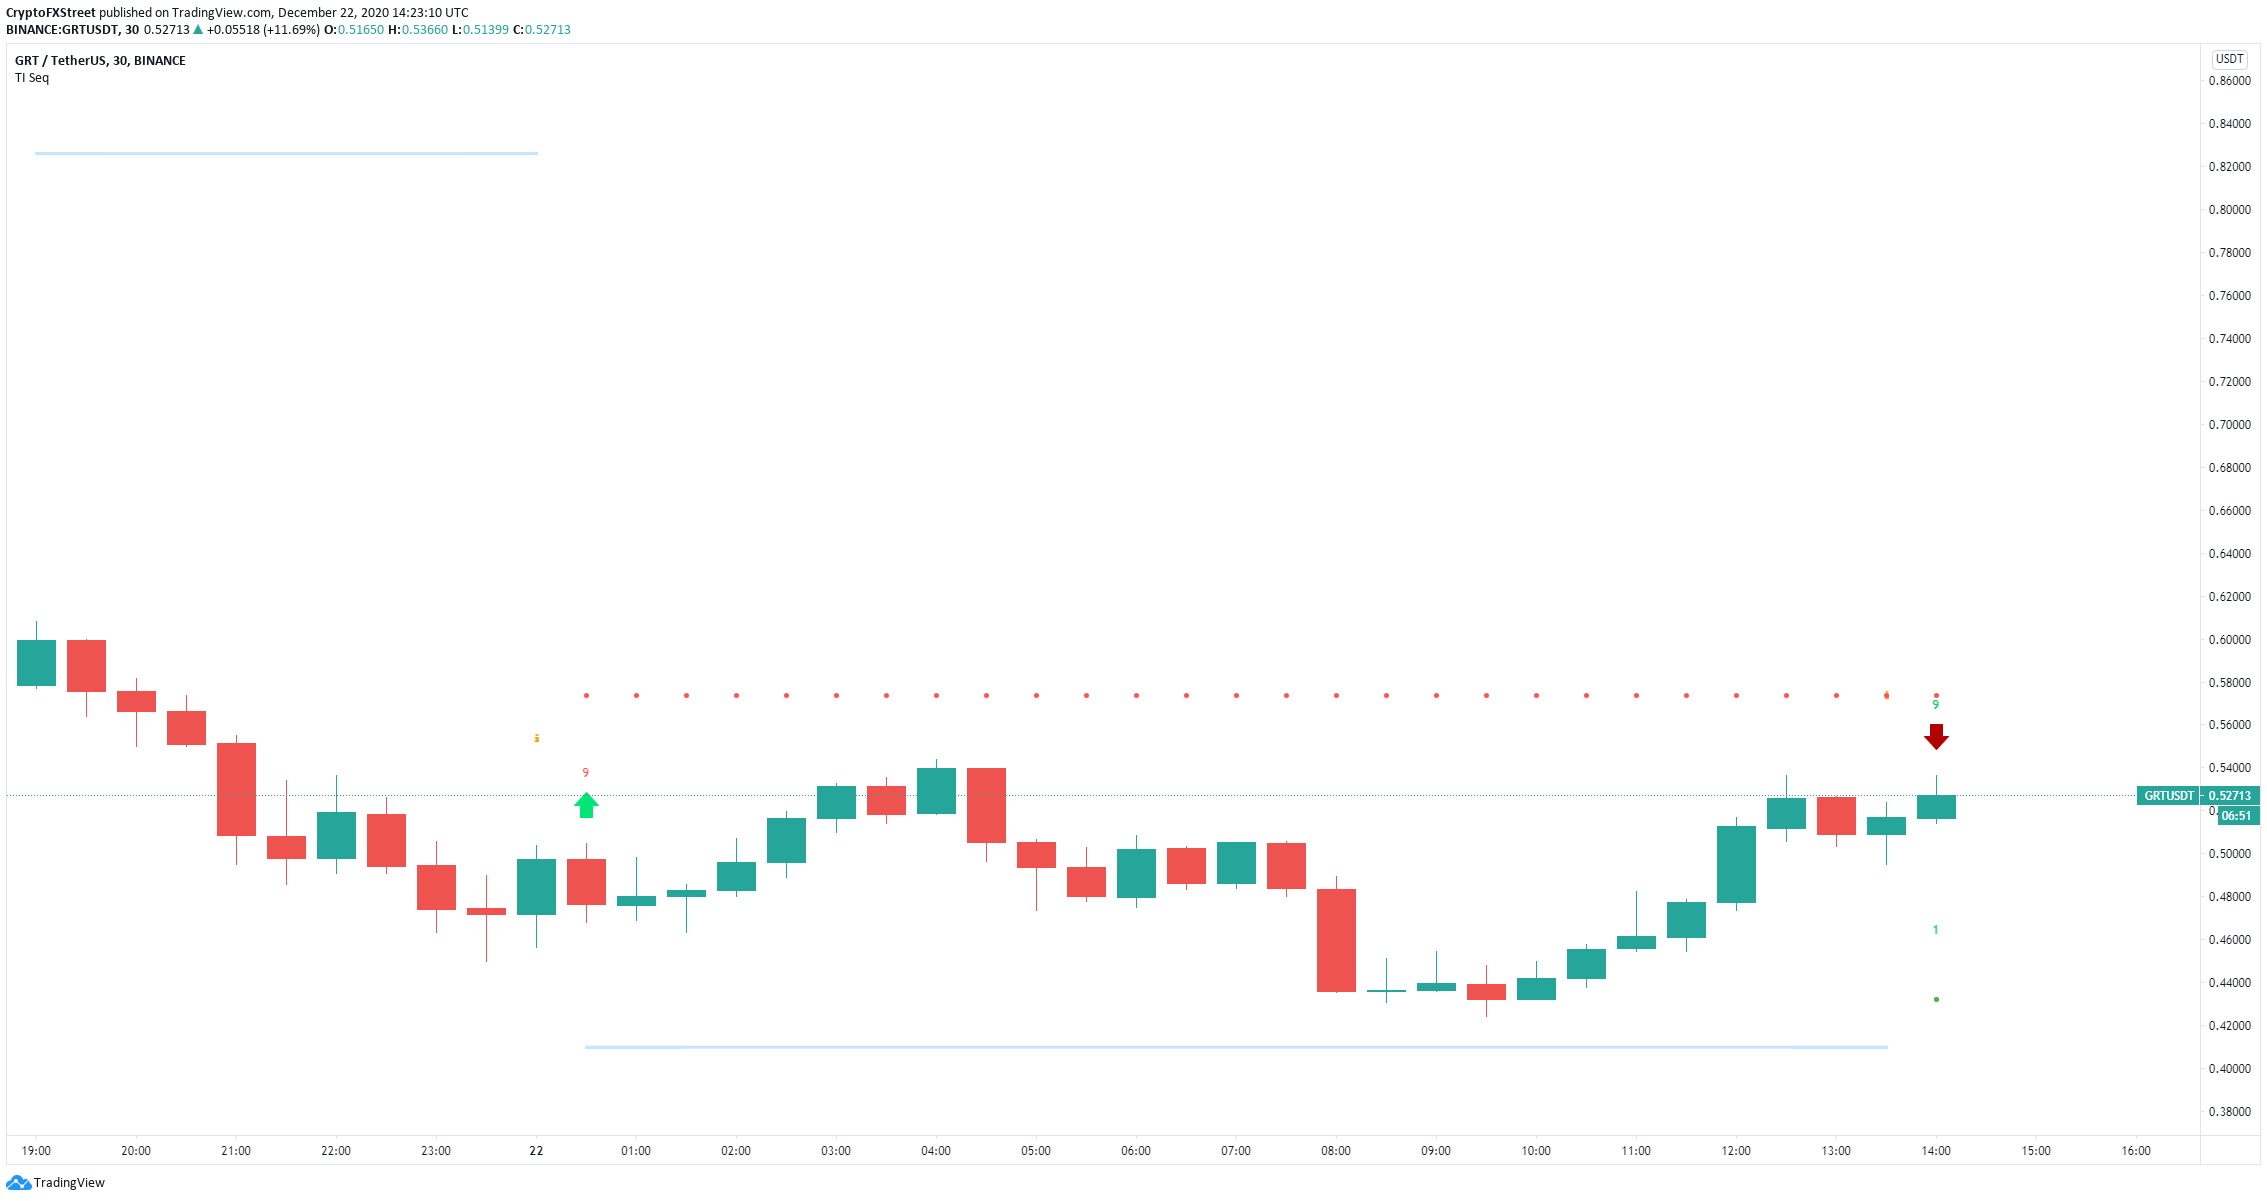
GRT/USD 30-minutes chart

Investors need to be extra careful as GRT price could fall lower. On the 30-minutes chart, the TD Sequential indicator has presented a sell signal which adds even more selling pressure. 
grt price

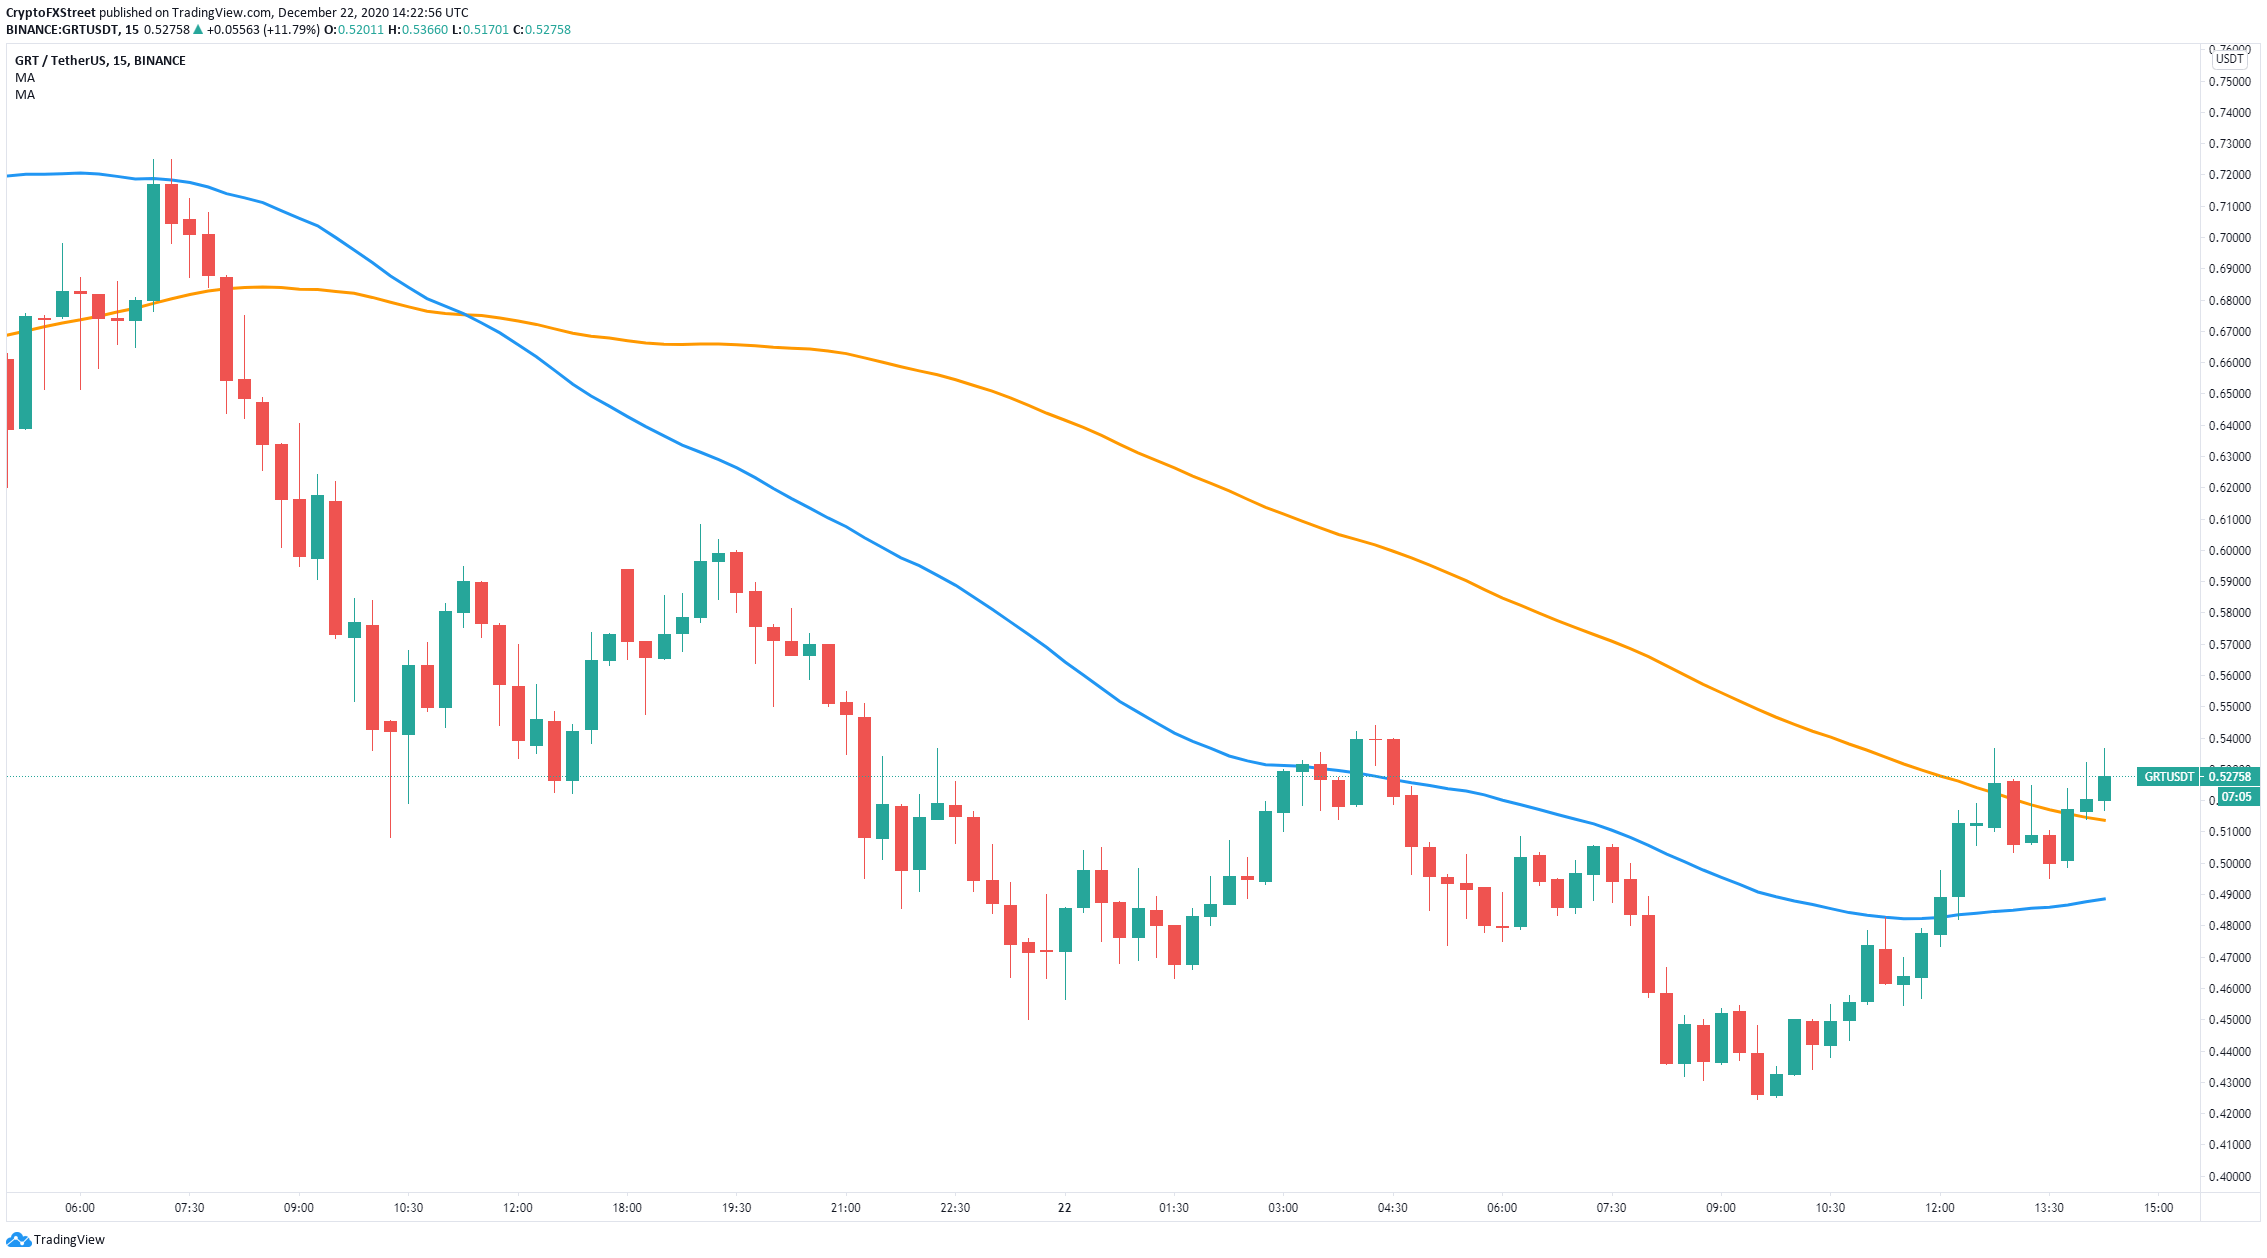
GRT/USDT 15-minutes chart

The Graph has been holding the 50-SMA support level on the 15-minutes chart for a while. However, a breakdown below this point can quickly drive GRT price towards the 100-SMA at $0.49. Failure to hold this level will push the digital asset to its last low at $0.42.

On the other hand, GRT bulls remain in control of the 15-minutes chart which is an uptrend. So far, they have defended the 50-SMA and aim to crack the last significant high at $0.543 which would push GRT price towards $0.6.

Author

Lorenzo Stroe

Lorenzo Stroe

Independent Analyst

Lorenzo is an experienced Technical Analyst and Content Writer who has been working in the cryptocurrency industry since 2012. He also has a passion for trading.


More from Lorenzo Stroe
Share:

Editor's Picks

Ripple and Stellar outlook: XRP and XLM await direction amid cautious sentiment

Ripple and Stellar trade cautiously as both tokens hover around key technical levels. XRP is testing resistance at its 50-day EMA, while XLM continues to consolidate around the $0.187 support zone. Meanwhile, mixed derivatives data with a slight bearish tilt suggests traders remain cautious, keeping the next directional move uncertain.

Crypto Market Overview: Bitcoin recovery eases – HBAR and LDO test key resistance zones

Bitcoin edges below $66,000 extending the previous day's losses. Hedera and Lido DAO sustain bullish momentum, testing the breakout of a crucial resistance zone to extend their rally. CoinMarketCap’s Fear and Greed Index at 39 stalls below the neutral territory, indicating that sellers remain dominant.

Senate Republicans release updated CLARITY Act with new crypto ethics restrictions

Senate Republicans released an updated version of the Digital Asset Market CLARITY Act on Wednesday following briefing calls with stakeholders. The update adds a package of ethics restrictions targeting digital asset activities by public officials and their spouses.

Hyperliquid, Robinhood could lead crypto’s next bull market as DeFi and TradFi converge
The next crypto bull market could be driven by the growing convergence between blockchain-based financial infrastructure (on-chain) and traditional finance (TradFi), according to Bitwise CIO Matt Hougan. In a report published late Tuesday, Hougan argued that crypto may be showing early signs of a market bottom, with Bitcoin gaining 9% since July 1 even as the NASDAQ 100 declined 6%.
Bitcoin’s potential recovery in the second half hinges on these 4 catalysts
Bitcoin (BTC) has fallen over 34% in the first half of this year as the King Crypto failed to capitalize on a good semester for risk assets despite the woes from the Iran war.


