The Graph Price Forecast: GRT is on a clear path to 30% upswing
- The Graph price is contained inside a descending wedge pattern on the 12-hour chart.
- The digital asset must reclaim a key resistance level to see a 30% move.
- GRT has a lot of bullish momentum in the short term.

In the past five days, The Graph managed to confirm a 12-hour uptrend and shifted the odds back in favor of the bulls. The digital asset faces low resistance ahead according, to key on-chain metrics.
The Graph price is on the verge of a breakout to $2.6
The Graph is trading inside a descending wedge pattern on the 12-hour chart. This can be drawn by connecting the lower highs and lower lows with two trend lines that converge. GRT broke out of this pattern on March 28 and retested the previous resistance trend line on April 7, successfully defending it.
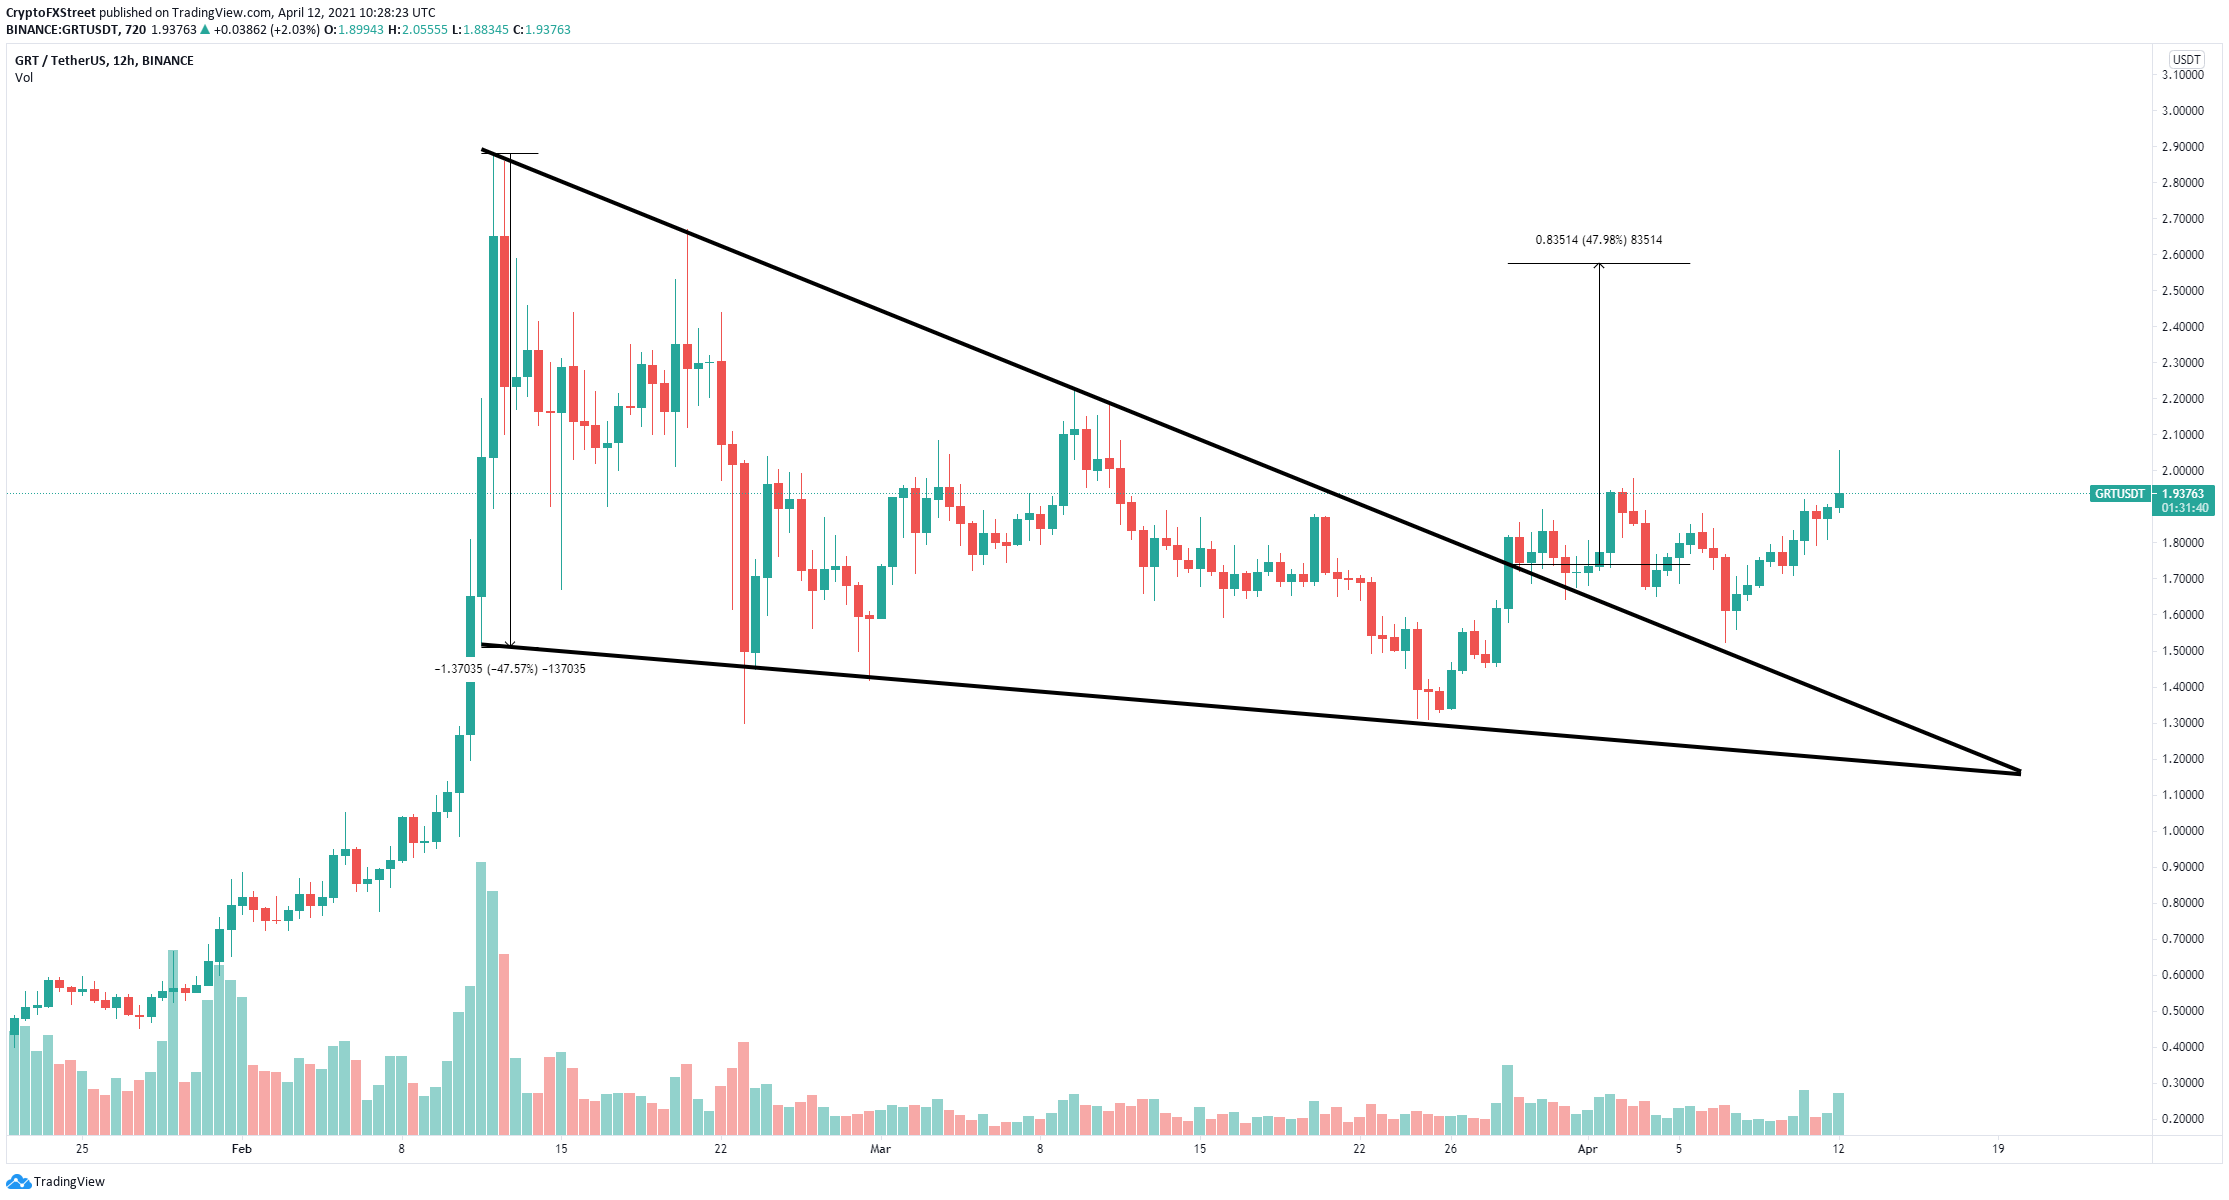
GRT/USD 12-hour chart
A breakout above $2.03 has a price target of $2.6, a 30% move. The previous target is calculated by measuring the distance between the beginning of the upper trend line and the lower trend line of the pattern.
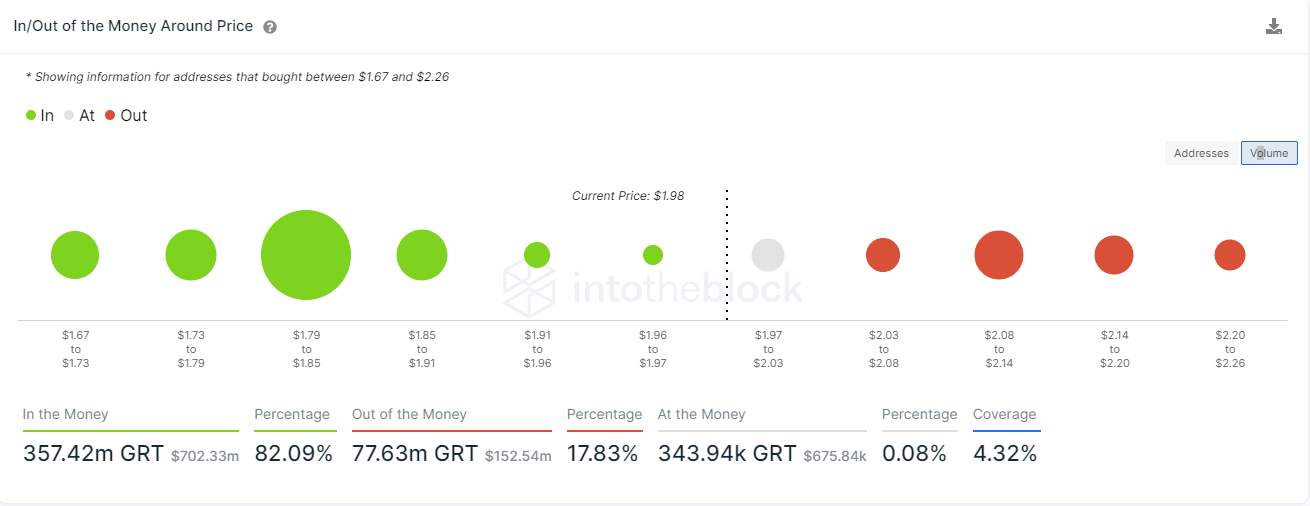
GRT IOMAP chart
The In/Out of the Money Around Price (IOMAP) chart shows only the key resistance area between $2.05 and $2.11 where 3,000 addresses purchased 25 million GRT.
Additionally, between $1.87 and $1.70, there is a ton of support as 14,000 addresses purchased over 330 million GRT. This range will be able to absorb a lot of sell orders in the short term.
However, a rejection from this key resistance area will be notable and can drive The Graph price down to the lower end of the massive support area between $1.87 and $1.70.
Author

Lorenzo Stroe
Independent Analyst
Lorenzo is an experienced Technical Analyst and Content Writer who has been working in the cryptocurrency industry since 2012. He also has a passion for trading.


