The Graph Price Prediction: GRT gears up for quick 15% upswing
- The Graph price is traversing under the middle line of an ascending parallel channel.
- A decisive close above the stiff resistance at $1.85 could kick-start this bull rally.
- Transactional data reveals the presence of a significant supply barrier at $1.81.

The Graph price is preparing itself for a swift run-up toward the upper boundary of a technical pattern.
The Graph price eyes higher high
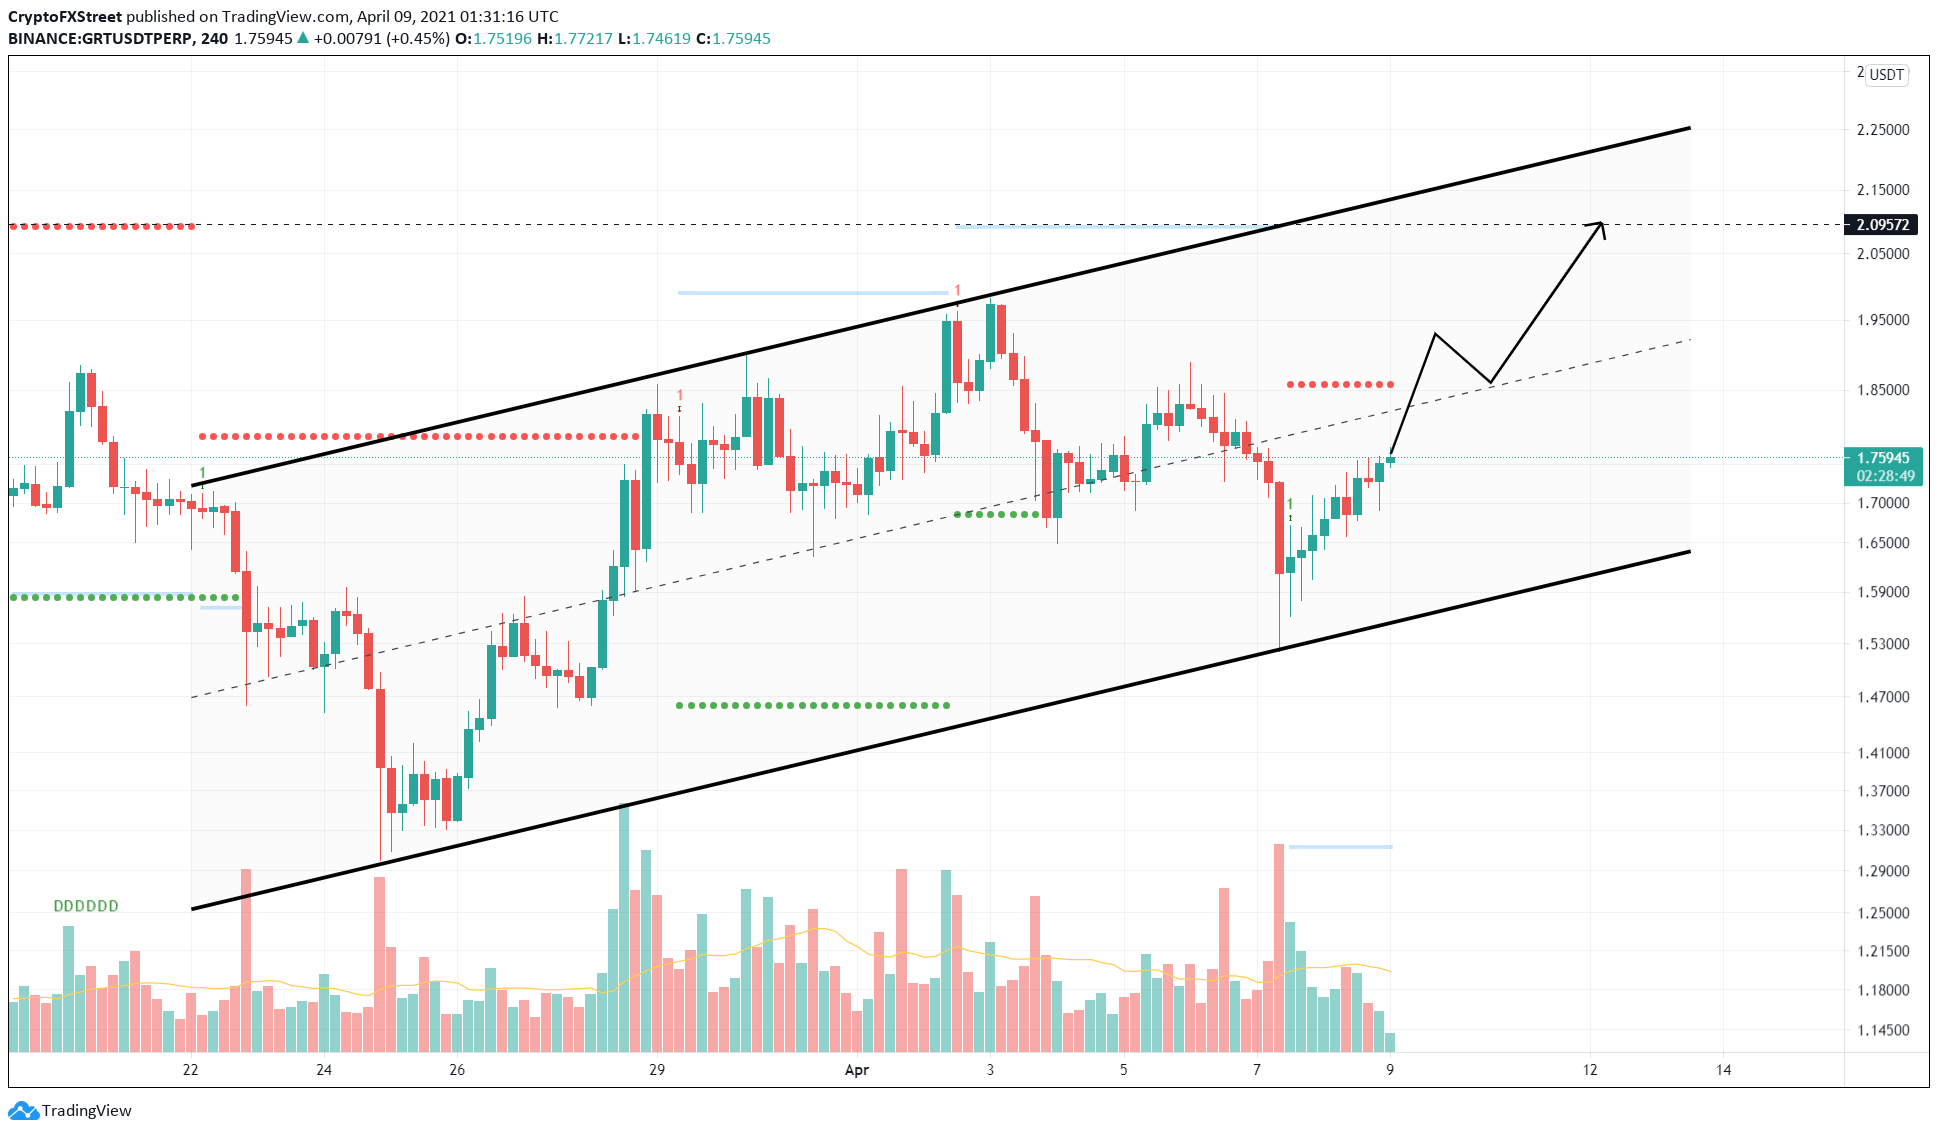
The Graph price has formed three higher highs and higher lows, which results in an ascending parallel channel when the swing points are connected using trend lines. After creating the recent swing low on April 7, the Momentum Reversal Indicator (MRI) flashed a buy signal in the form of a green 'one' candlestick on the 4-hour chart.
This setup suggests a reversal in trend is underway in the form of one to four green candlesticks. Since this sign, GRT has surged nearly 10% and shows signs of continuing this upward trend as it heads near the middle line of the ascending parallel channel.
Here, the Graph price faces a crucial resistance zone that ranges from $1.81 to $1.85. The upper boundary of this supply zone is due to the MRI’s recently spawned State Trend Resistance.
Hence, for any chance of an upswing, GRT needs to breach through this zone. Assuming buyers manage to produce a decisive close above $1.81, the Graph price could surge 15% toward the next area of interest at $2.09. This level coincides with the MRI’s breakout line. Therefore, breaching this level will open GRT up for another 15% upswing to $2.41.
GRT/USDT 4-hour chart
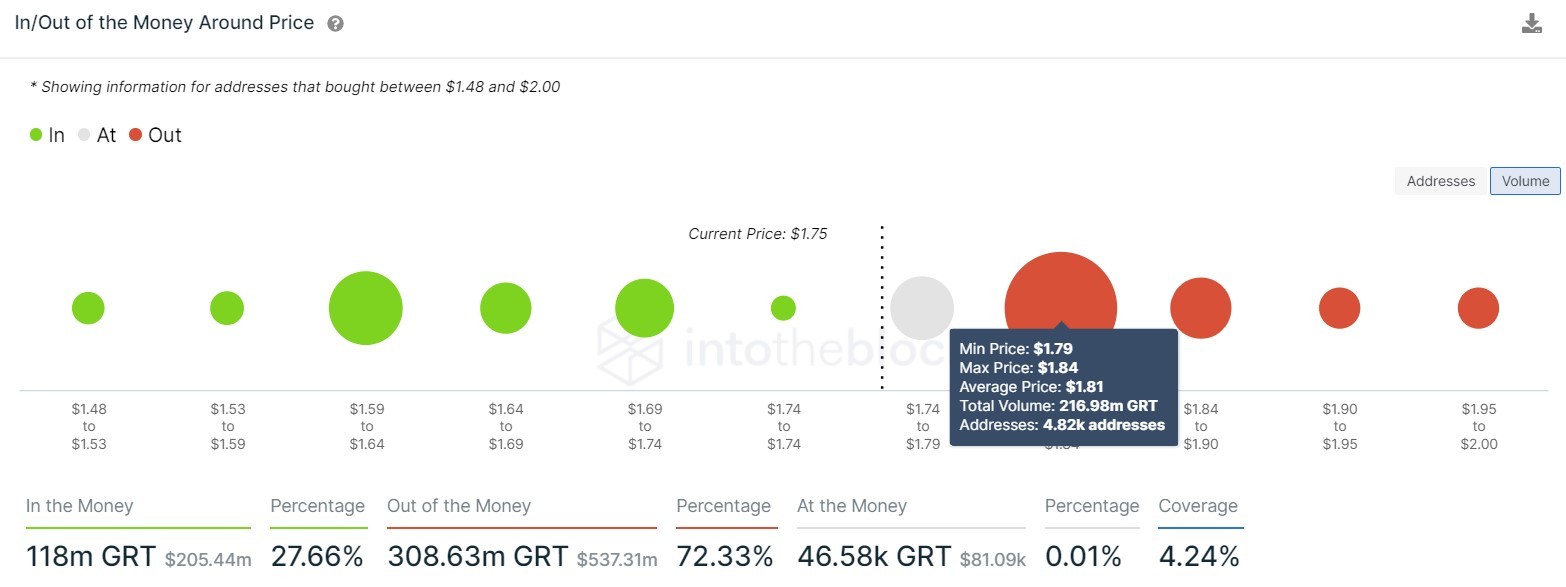
Supporting this bullish narrative for the Graph price is IntoTheBlock’s In/Out of the Money Around Price (IOMAP) model, which shows $1.81 as a major hurdle for GRT bulls. Here, roughly 4,800 addresses that purchased 217 million GRT are underwater.
Hence, a convincing 4-hour candlestick close above this level will set the stage for more gains.
GRT IOMAP chart
On the flip side, the IOMAP cohorts reveal a small cluster of investors around $1.61, where 600 addresses hold about 64 million GRT. Interestingly, this level coincides with the lower trend line of the ascending parallel channel.
A breakdown of this level will result in a 10% drop to the MRI’s State Trend Support at $1.46. The bullish thesis will face invalidation if the sellers push the Graph price below the level mentioned above.
In such a scenario, GRT could slide another 10% to $1.31.
Author

Akash Girimath
FXStreet
Akash Girimath is a Mechanical Engineer interested in the chaos of the financial markets. Trying to make sense of this convoluted yet fascinating space, he switched his engineering job to become a crypto reporter and analyst.