The Graph Price Forecast: GRT explodes towards $3 thanks to massive network growth
- The Graph price has reached $2.88 for the first time ever.
- The digital asset has experienced massive growth in active and new addresses joining the network.
- GRT is at risk of a short-term pullback according to one key indicator.

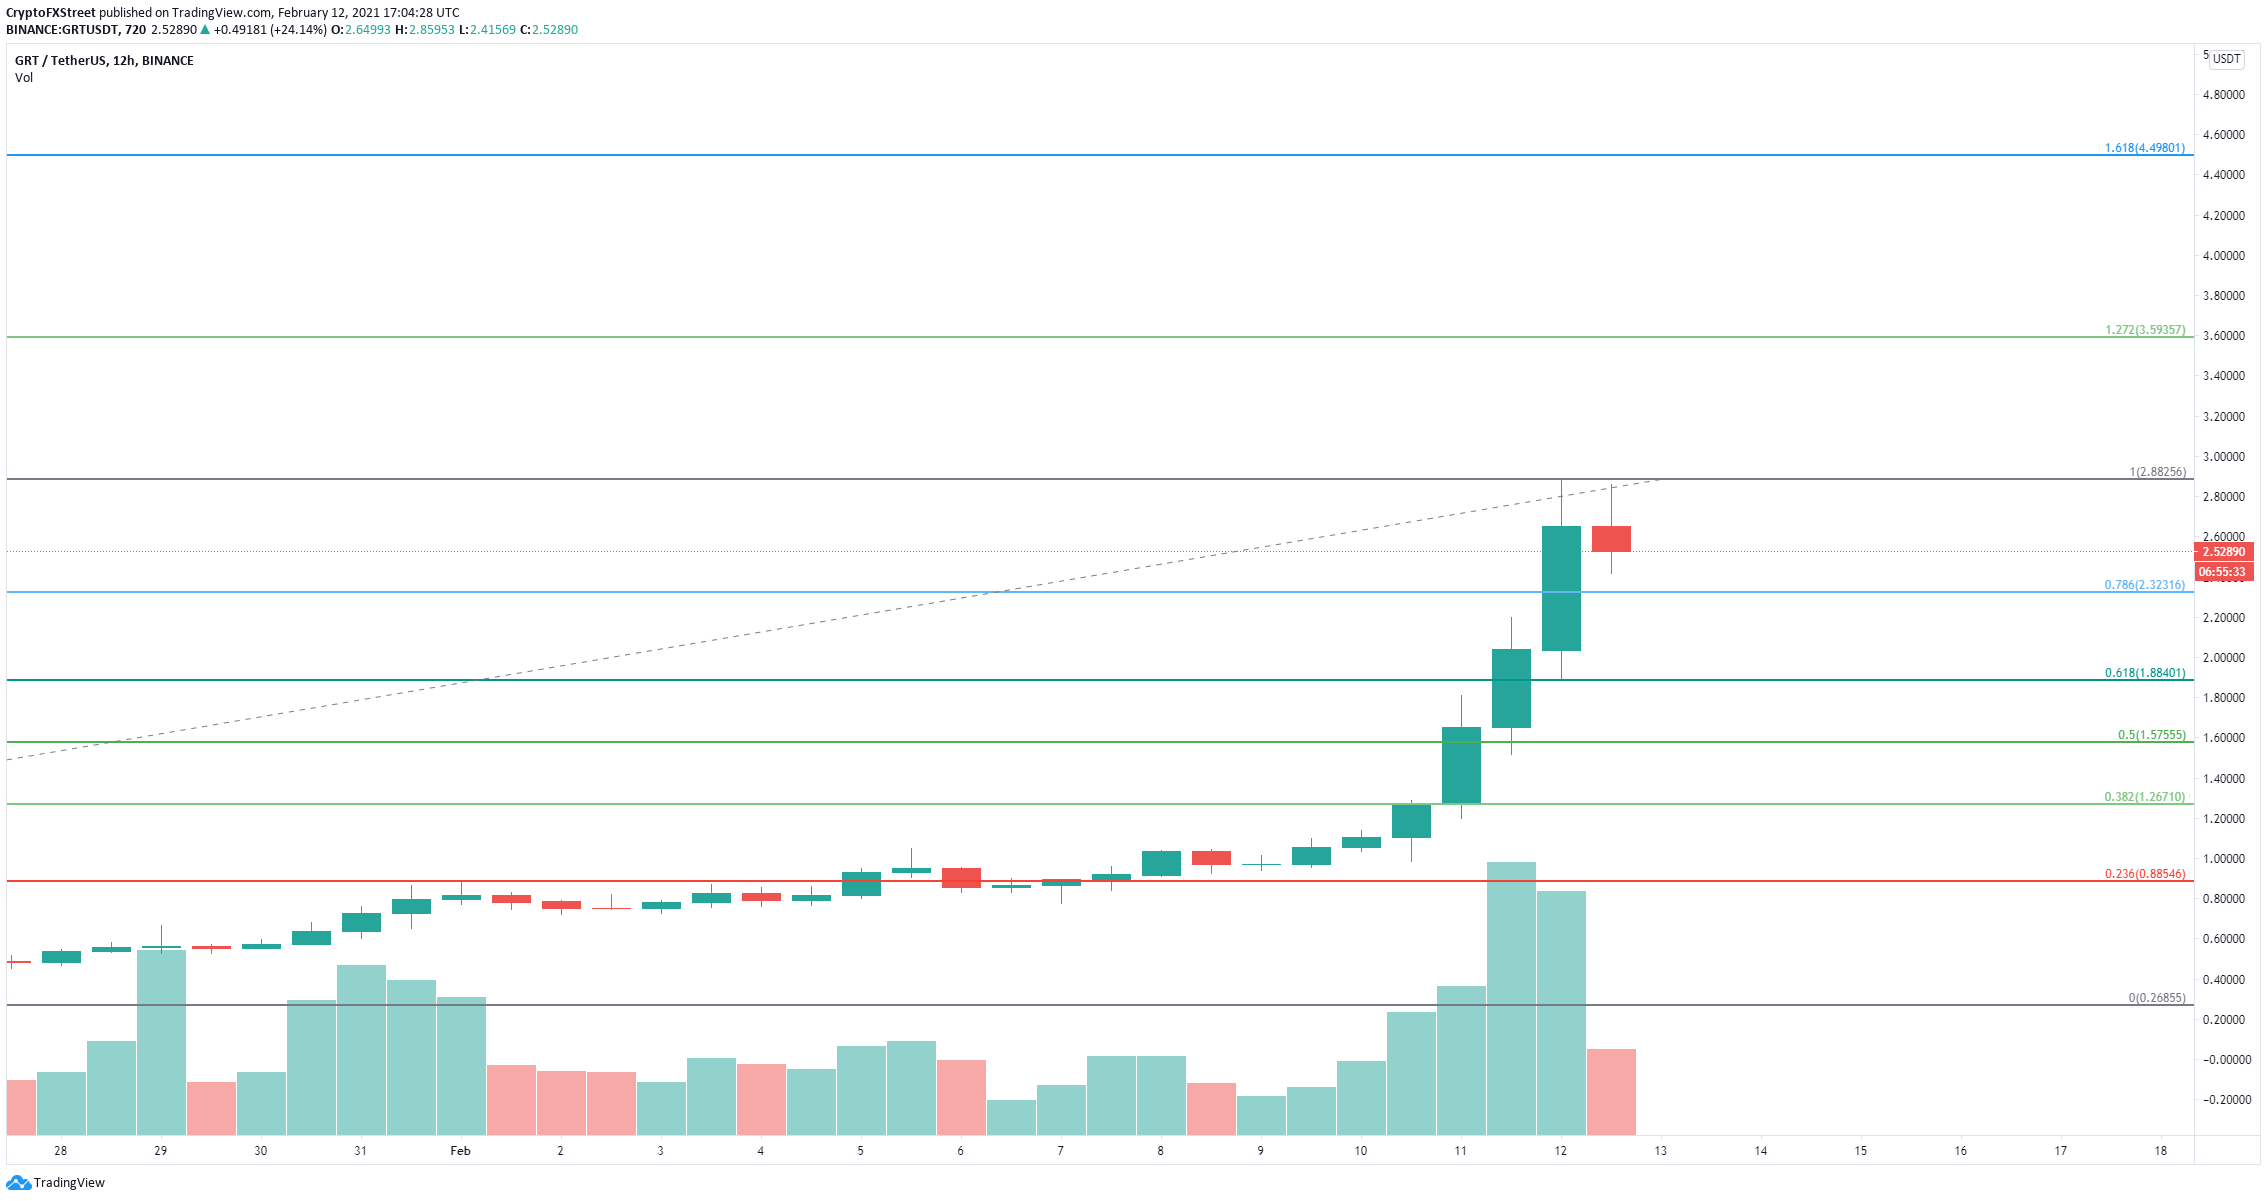
The Graph price had an amazing performance in 2021 climbing from a low of $0.366 on January 1 to the current $2.88 high. GRT has reached a market capitalization of $3.15 million and experienced $4.5 billion in trading volume in the past 24 hours, another all-time high.
The Graph price aims for more, but a pullback is needed before the next leg up
After reaching $2.88, the TD Sequential indicator presented a sell signal on the 12-hour chart which seems to be getting some bearish continuation as GRT is already down by around 14% since the call.
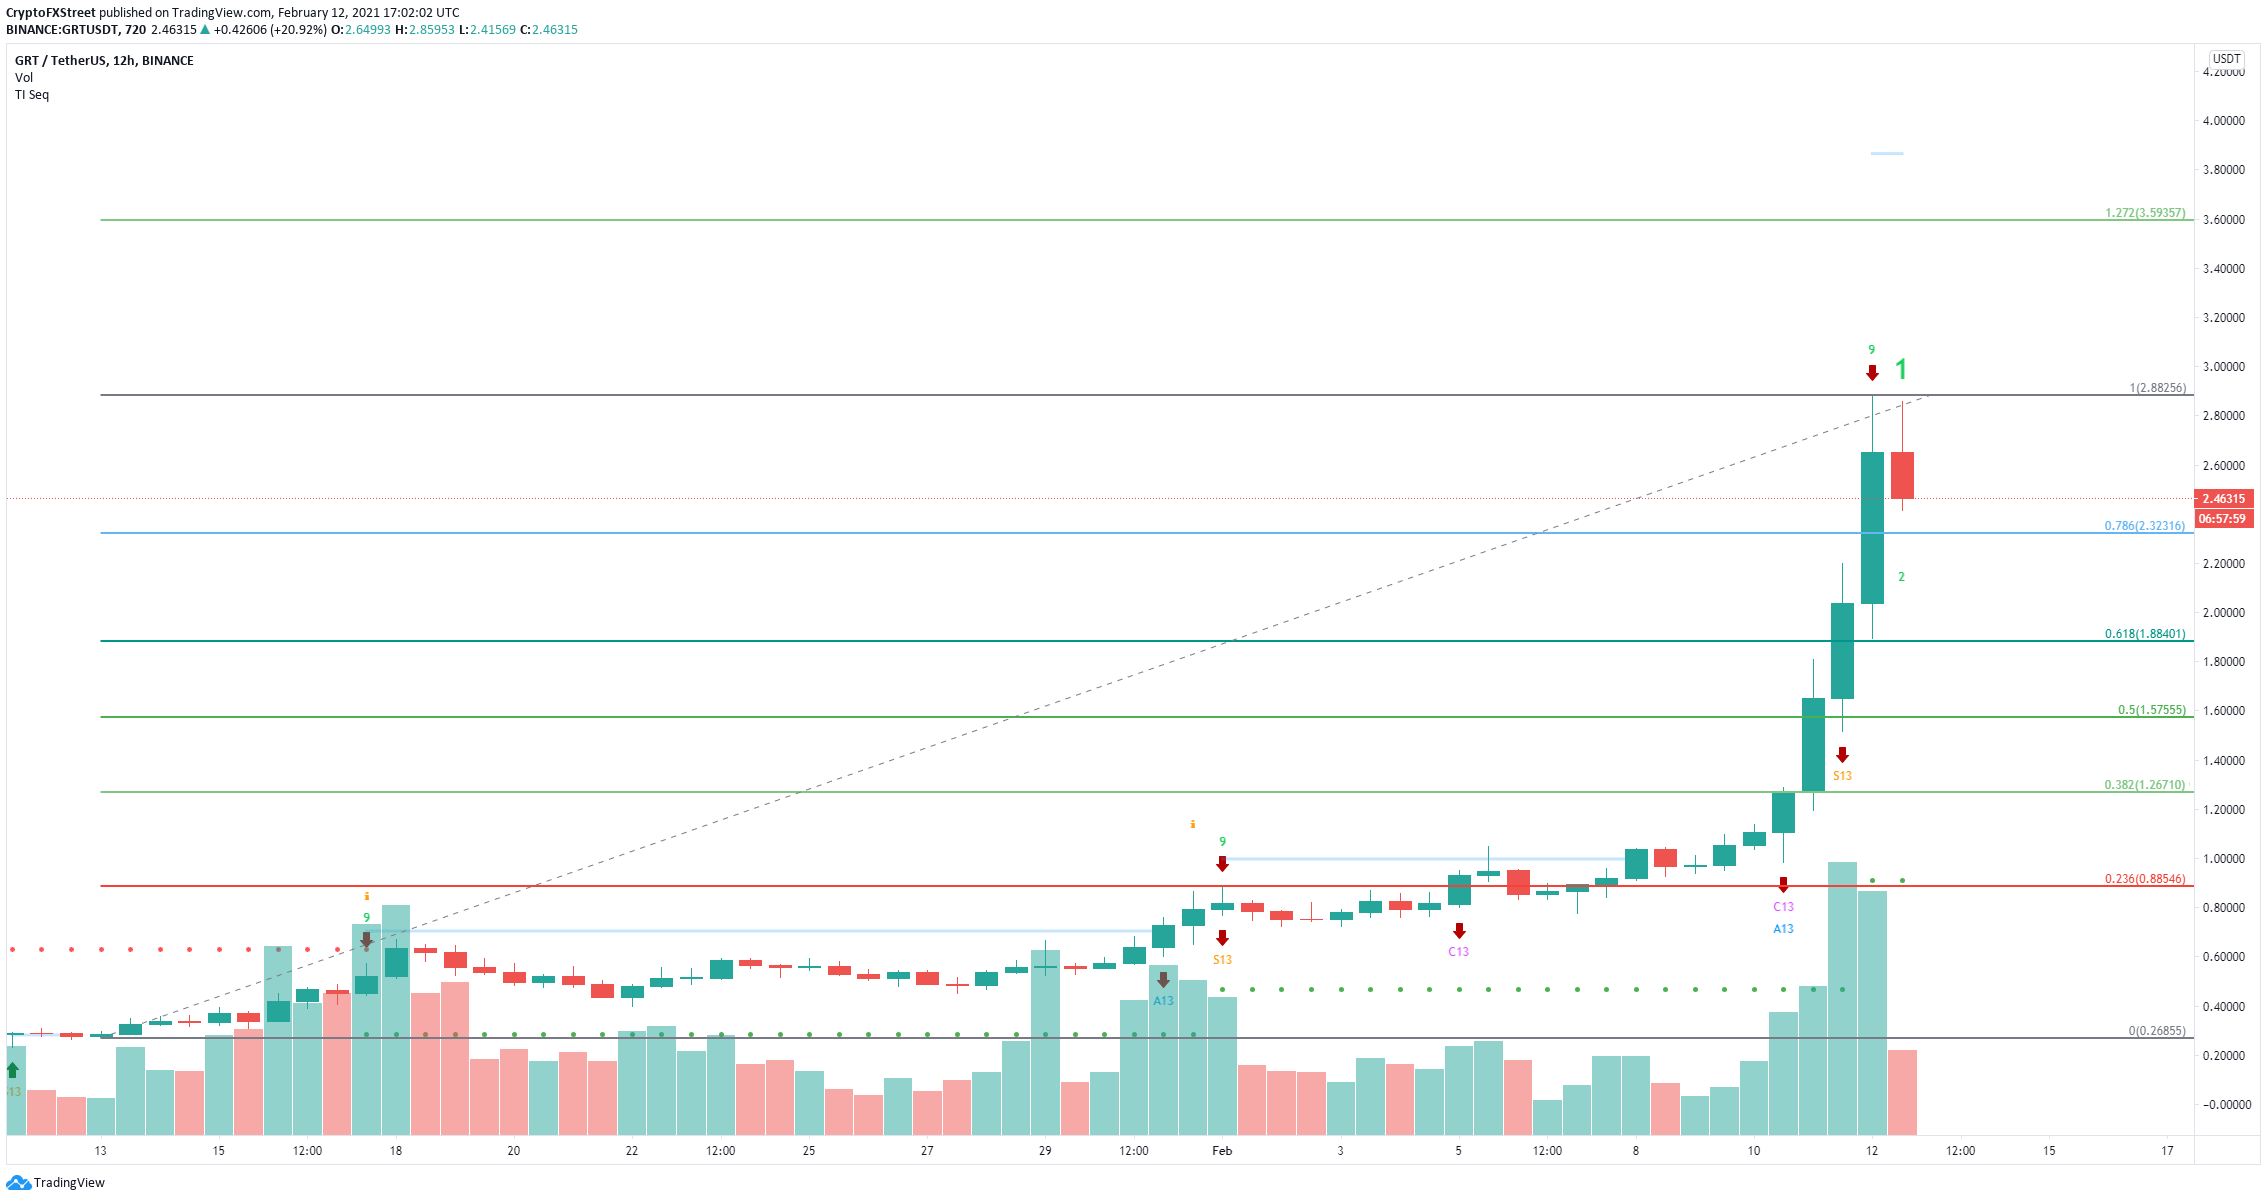
GRT/USD 12-hour chart
Using the Fibonacci Retracement tool, we can determine several potential bearish price targets on the way down. The nearest is located at $2.32, the 78.6% level. If this point fails to hold, The Graph price can slide down to $1.88, at the 61.8 Fib level.

GRT Network Growth
However, the recent rally seems to be extremely healthy as the number of new addresses joining the network exploded by 200% in the past week. Similarly, the amount of active addresses also increased by 215% in the last seven days, indicating a massive network growth in accordance to the price growth.
GRT/USD 12-hour chart
To invalidate the bearish outlook and the sell signal, GRT bulls need to push the digital asset above $2.88. The next potential price target is $3.6, the 127.2% fib level. The Graph price can rise as high as $4.5 at the 161.8% level.
Author

Lorenzo Stroe
Independent Analyst
Lorenzo is an experienced Technical Analyst and Content Writer who has been working in the cryptocurrency industry since 2012. He also has a passion for trading.


