Tezos Market Analysis: XTZ/USD bears test the $3.10 psychological level
- XTZ/USD bears took back control after a bullish Friday.
- The SMA 20 looks to crossover the SMA 50 and chart the bullish cross.
- William’s %R is trending at the edge of the overbought zone.

XTZ/USD daily chart
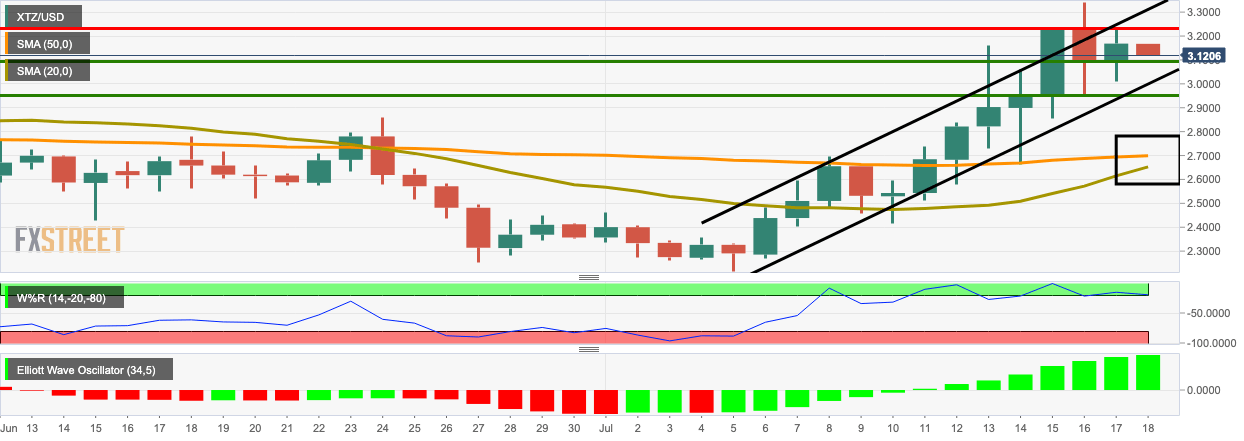
XTZ/USD bears took back control this Saturday as the price dropped from $3.17 to $3.11. The bears are trying to lower the price below the $3.10 psychological level, even as XTZ/USD trends in an upward channel formation. The SMA 20 looks to cross above the SMA 50, to chart a bullish cross pattern.
The Elliott Oscillator has gone up from -0.3 to 0.5 over the last 14 days, which shows that the current market sentiment is overwhelmingly bullish, despite this Saturday’s bearish price action. However, it doesn’t look like we have seen the last of the bears. The William’s %R is still trending at the edge of the overbought zone, so more bearish correction is expected.
Support and Resistance
XTZ/USD has strong resistance at $3.23. On the downside, healthy support levels lie at $3.09 and $2.9575.
Author

Rajarshi Mitra
Independent Analyst
Rajarshi entered the blockchain space in 2016. He is a blockchain researcher who has worked for Blockgeeks and has done research work for several ICOs. He gets regularly invited to give talks on the blockchain technology and cryptocurrencies.


