Terra’s LUNA price is in the process of validating a 15.50% bearish move
- LUNA price is in danger of sliding to $2.00 due to the formation of a falling triangle pattern.
- Terra and Thorchain (in one contract) top the ten chains indexed for the Terra Phoenix airdrop.
- LUNA price will invalidate the expected downtrend to $2.00 if it closes the day above the 100-day SMA.
Terra’s LUNA price is dealing with extreme market indecision on Sunday after pulling back from resistance at $2.60. This downward pressure it faces will likely stretch into the new week. Technical analysis using chart patterns and carefully chosen indicators point to a 15.50% dip to $2.00.
Terra and Thorchain top the Terra Phoenix airdrop
Terra, a cryptocurrency ecosystem powered by LUNA, has announced the successful completion of its Terra Phoenix airdrop. According to the airdrop’s statistics, Terra & Thorchain (in one contract) emerged top, claiming 50.50% of the tokens allocated to it.
Polygon came in the second position with 85,674, representing 20.8% of the network’s allocated tokens. Ethereum closed the top four, claiming 6.90% of the 4,877,832 assigned tokens.
The Terra Phoenix airdrop was designed to redistribute 19,504,909 LUNA tokens from the Community Pool to users who did not get the correct allocation during the Genesis.
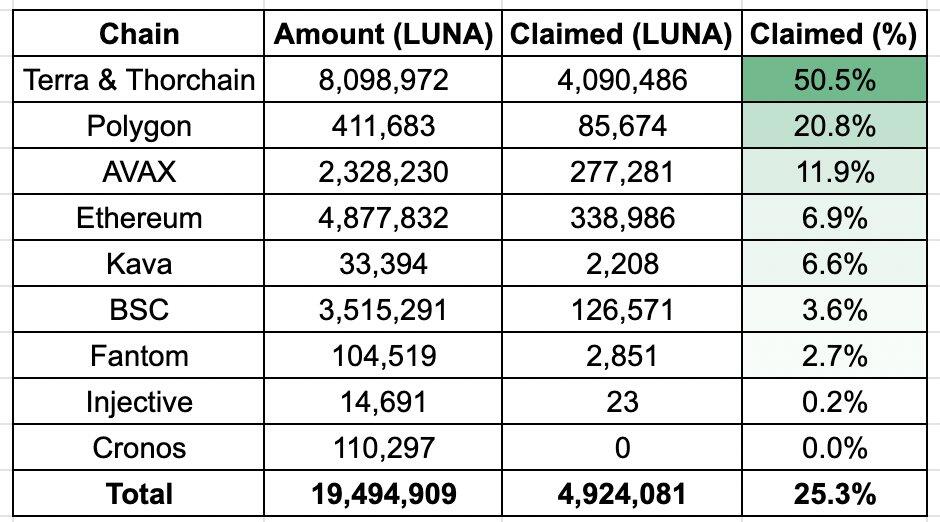
Terra Phoenix airdrop
As Terra’s development team works toward repairing its image after the crash in May, LUNA price might tap into the growing liquidity and post a rally. However, the general technical outlook suggests that recovery may have to wait until the sidelined investors board the bandwagon at a lower price level.
LUNA price nurtures a downtrend
LUNA price is holding at the 50-day SMA (Simple Moving Average), red, despite the 100-day SMA, blue capping movement immediately to the upside. A break above the falling trend line could see LUNA price shun the foreshadowed retracement. Nonetheless, low trading volume coupled with the conditions of a bear market hint at its downtrend extending below the falling triangle pattern.
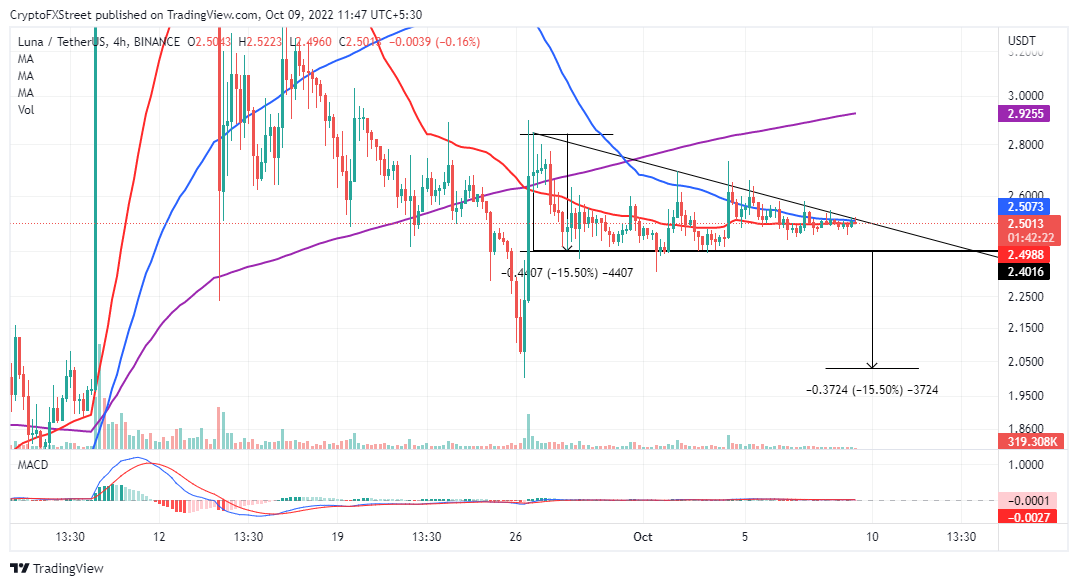
LUNA/USD four-hour chart
Falling triangles have a bearish bias, but traders must wait for a break below the x-axis support before entering short positions. A 15.50% move, a distance equal to the widest points of the triangle, is expected if the triangle matures.
Author

John Isige
FXStreet
John Isige is a seasoned cryptocurrency journalist and markets analyst committed to delivering high-quality, actionable insights tailored to traders, investors, and crypto enthusiasts. He enjoys deep dives into emerging Web3 tren



