Terra Luna price action, even without current macro events, is not in a good place
- Terra price action is stuck in a bearish triangle with $2.09 as the floor.
- Luna price action is at risk of a bearish breakout as volatility picks up with the US midterms.
- Expect a nervous and choppy price reaction as midterms results and inflation numbers later this week will determine the path from now on.

Terra (Luna) price action takes a step back after the 55-day Simple Moving Average (SMA) kicks in as a bearish cap above the price action. With the broader term bearish triangle, even without the current volatility and tail risks at hand, Terra price action is continuing its downward path and is soon set to break toward $1.45 in the medium term. The current market events and tail risks can speed up that timeline as volatility is set to pick up again with the midterms and US inflation numbers in the coming hours and days.
Terra Luna price is under pressure from all angles
Terra price action took a step back on Saturday after the US job numbers on Friday triggered euphoria among investors and closed that last trading day of the official work week at the monthly pivot near $2.60. Unfortunately, quick profit-taking happened over the weekend with price action completely paired back by Sunday evening. Bulls tried to reclaim the positive sentiment from Monday but were no match for selling investors that wanted to get out before the US midterms, and US inflation numbers are set to come in as of this evening.
Luna price action is facing some whipsaw price action with quite a few tail risks set to be inflated. Expect that price action to move within the boundaries of the bearish triangle with the topside descending trend line near $7.75 and the downside being the floor at $2.09, the low of September 14. Once that breaks, expect to see a nosedive move toward $1.45, heading toward the low of July 13, with the monthly S1 and S2 support levels along the way not providing much support and rather being seen as speed bumps.
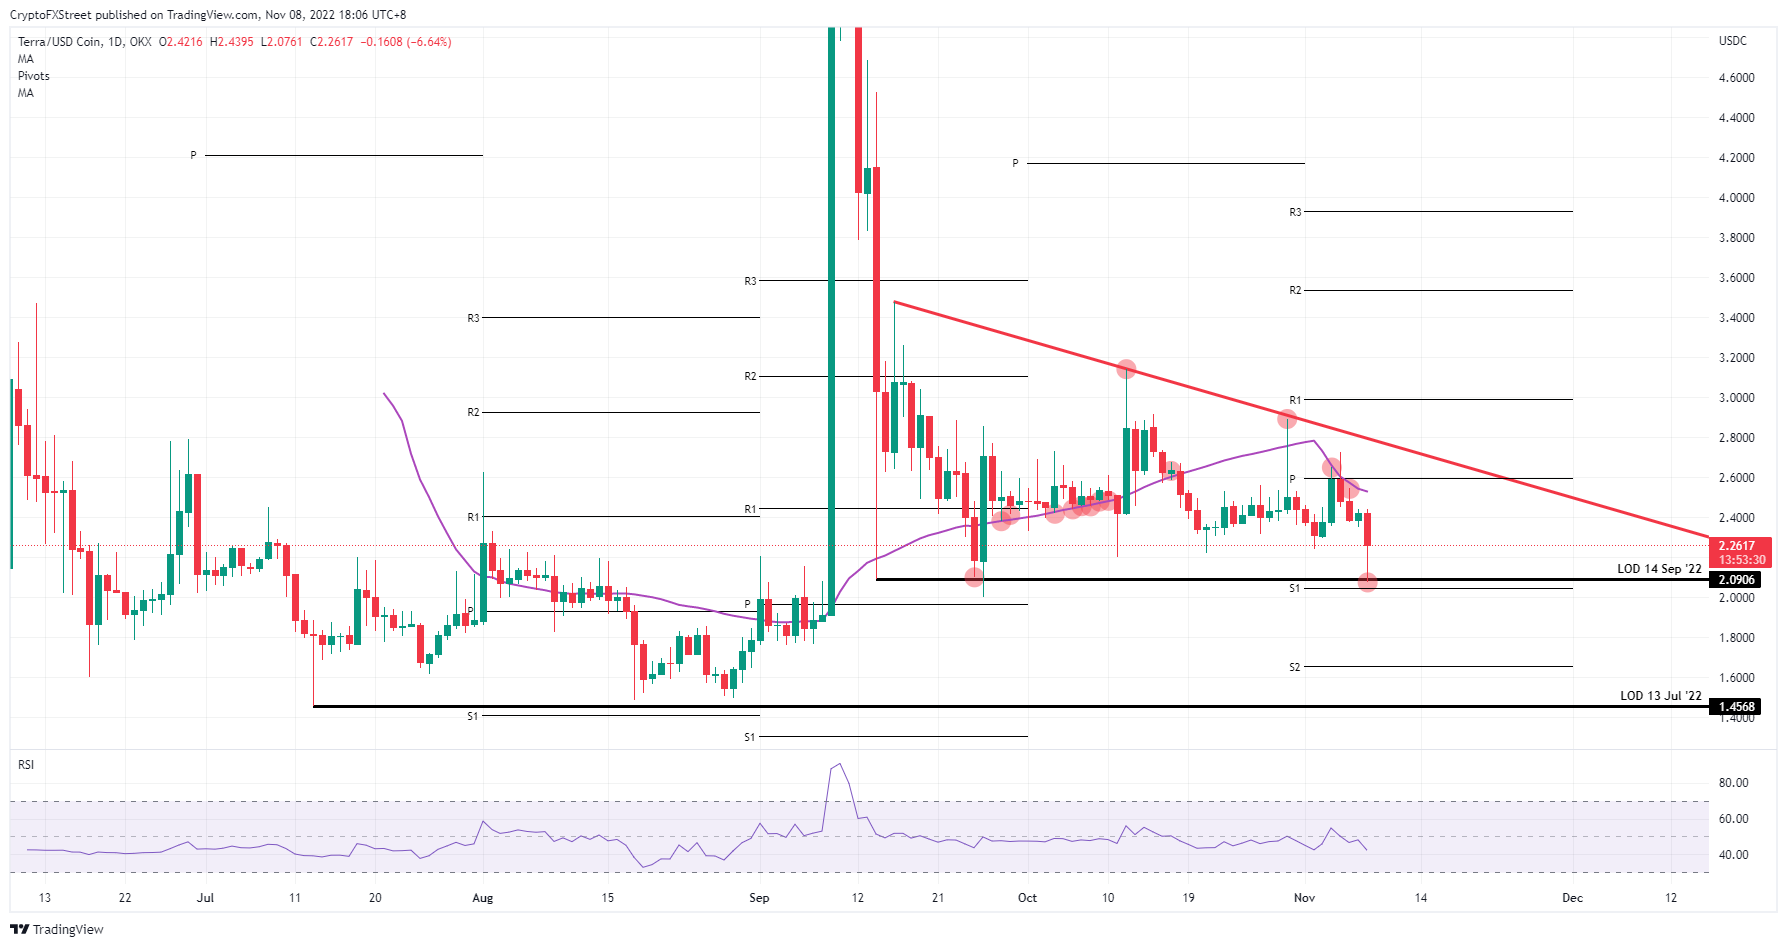
LUNA/USD daily chart
To the upside, even a bullish breakout could come should the two main events result in favor of risk. That would be in case inflation comes in much lower than expected on Thursday and should the US senate elections remain unchanged and not need any run-off by-elections to determine who wins. The risk premiums currently priced in would be taken out and quickly see Luna price action break above the red descending trend line toward $3 at the R1 resistance level.
Author

Filip Lagaart
FXStreet
Filip Lagaart is a former sales/trader with over 15 years of financial markets expertise under its belt.


