Synthetix Price Forecast: SNX rebounds strongly, stalls under $5
- Synthetix leads the recovery in the crypto market alongside Chainlink and Ren.
- Synthetix upside capped under $5.00, the price is likely to settle for consolidation.

The decentralized finance (DeFi) token, Synthetix along with other selected cryptocurrencies like Chainlink (LINK) and Ren (REN) decoupled and rallied extensively in the last 24 hours. Although the flagship cryptocurrency, Bitcoin, also pushed above some key levels, the breakout made by these three digital assets has accrued over 20% in gains.
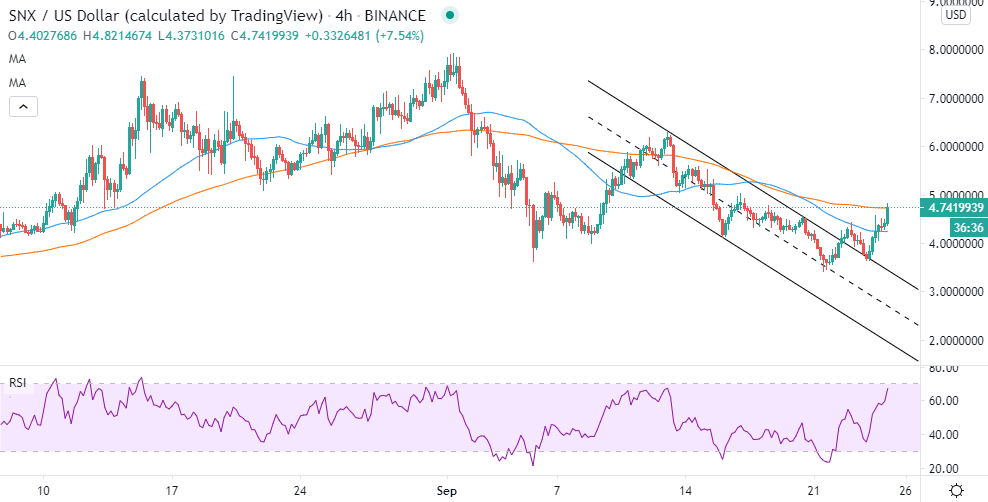
Synthetix is up 26% in the last 24 hours to exchange hands at $4.74. All the attention is channeled to the next key hurdle at $5.00. If the resistance is broken, it will pave the way for more action towards $6.00.
Synthetix adopts Layer-2 scaling solution
Ethereum is the core platform for the execution of DeFi tokens such as SNX. However, exorbitant gas fees are becoming an issue of concern. Although Ethereum 2.0 upgrade is expected before the end of the year, developers cannot sit and wait. For this reason, solutions that have come up to help DeFi projects bring down the transaction fees in the meantime.
Synthetix is the first among many DeFi projects to implement a barely tested but secure Layer-2 solution. The upgrade will see the protocol curb the high gas fees via the implementation of a couple of proposals; Fomalhaut (which went live on September 24) and Deneb, scheduled for September 29. Fomalhaut is expected to remove transaction fees for minor SNX stakers. Other DeFi projects are also considering the upgrade, including Aave (LEND) and UniSwap (UNI).
Synthetix breaks the parallel descending channel resistance
Following the bearish wave that swept throughout the crypto market earlier in September, SNX/USD established support at $3.50. This support has been tested twice in less than a month. Initially, SNX rebounded, stepping marginally above $6.00. However, increased seller activities saw it lose ground to the same $3.50. The ongoing recovery has made it above the parallel descending channel resistance, giving credence to the bulls' return.
Meanwhile, the immediate upside is capped by the 100 Exponential Moving Average (EMA) in the 4-hour range. Turning this moving average into support could boost Synthetix past $5.00, hence commencing the next phase of the rally to $6.00. The momentum is supported by the Relative Strength Index (RSI) as it closes in on the overbought region.
SNX/USD 4-hour chart
IntoTheBlock’s IOMAP model reveals a challenging resistance zone between $4.75 and $4.89. This range carries around 600 addresses that previously bought 3.77 million SNX. Bulls will have a hard time penetrating this area; however, if they manage to turn it into a support, the rally to $6.00 will become apparent.
SNX IOMAP chart
-637366034962290513.png)
On the downside, SNX is sitting above an area with immense support. The region between $4.46 and $4.60, where nearly 980 addresses purchased 6.72 million SNX, is strong enough to absorb most of the selling pressure in case of a reversal.
Looking at the other side of the picture
Synthetix has rallied massively in the last 24 hours. However, it is essential to realize that a retreat is likely, mostly if the resistance between $4.75 and $4.89 remains intact. IntoTheBlock’s “Daily Active Addresses” model shows a slump in the number of new addresses joining the network over September.
SNX new addresses chart
-637366035570743825.png)
The token is likely to lack the inflow volume to support the uptrend hence the possibility of stalling. Note that we do not expect SNX to plunge below the critical support highlighted by the IOMAP between $4.46 and $4.60.
Author

John Isige
FXStreet
John Isige is a seasoned cryptocurrency journalist and markets analyst committed to delivering high-quality, actionable insights tailored to traders, investors, and crypto enthusiasts. He enjoys deep dives into emerging Web3 tren



