ChainLink Price Analysis: LINK sees a 23% price bounce and it’s eying up $10
- LINK is currently trading at $8.80 after a notable rebound from the low at $7.31
- ChainLink is down 56% since its peak at $20.
-637336005550289133.jpg)
ChainLink has established a robust daily downtrend with bulls unable to come back. The digital asset is still up almost 500% since its 2020-low at $1.51.
LINK/USD daily chart
-637365546157428104.png)
LINK price has been rejected from the 12-EMA several times now. The most recent bounce happened at $7.31, a level close to the crucial support level of $7. LINK is trading at $8.8 after a slight rejection from $9.
LINK IOMAP Chart
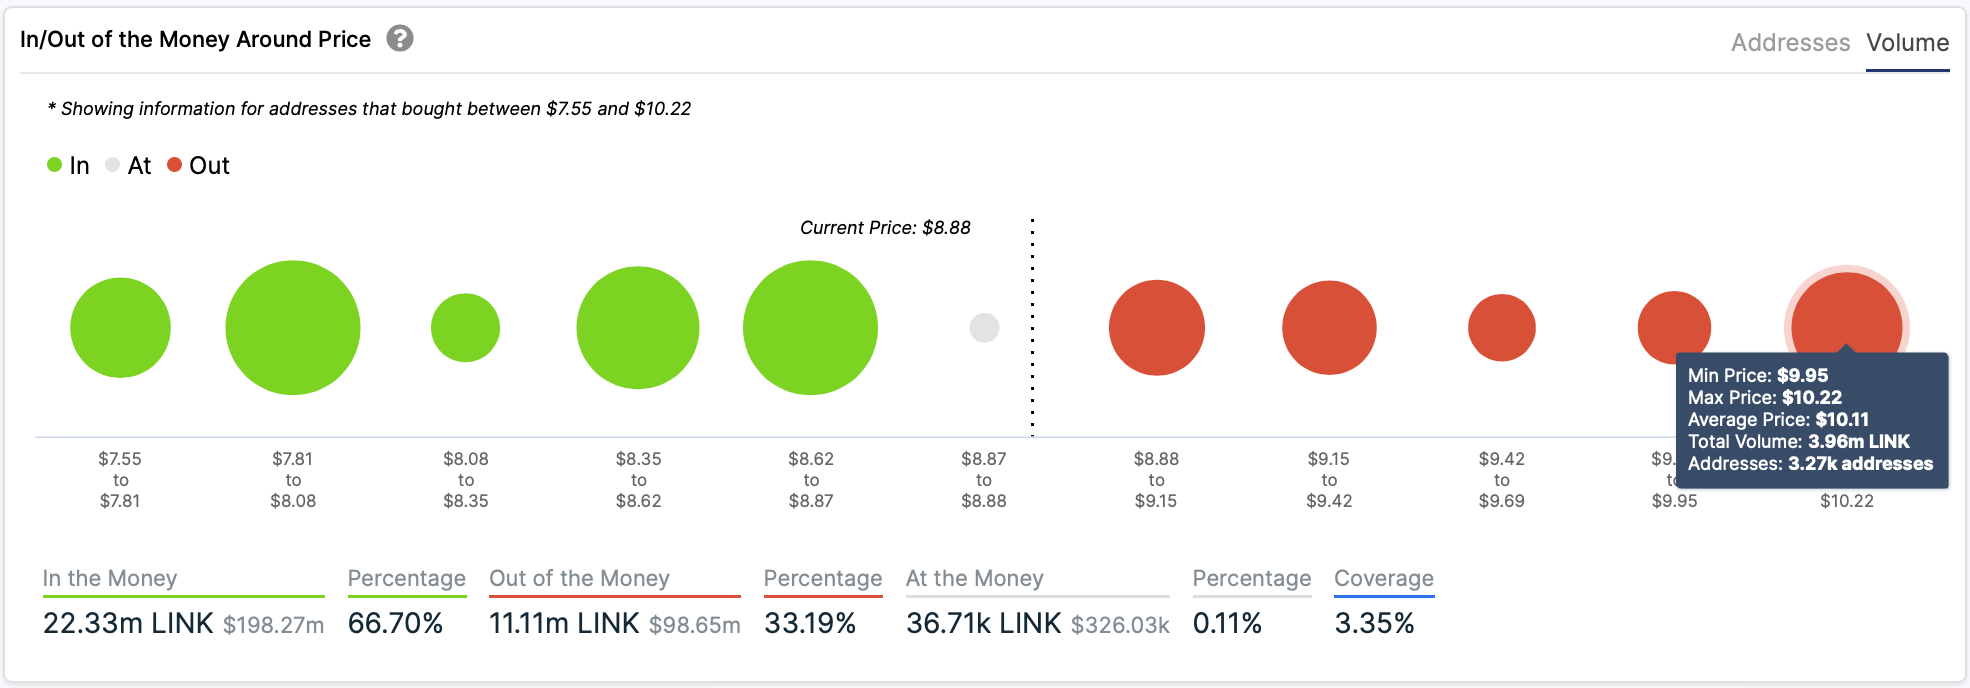
Looking at the In/Out of the Money Around Price chart by IntoTheBlock, we can observe that a large number of investors bought at $10, which creates a healthy resistance level. At the same time, many investors also got in at $8.8, $8.6, and $8. The area at $8 and above represents a strong support level.
Bulls are eying up $10 as the next resistance level, which coincides with the 12-EMA at $9.8 currently. The MACD remains bearish but could turn bullish within the next few days if the momentum continues favoring buyers.
LINK/USD 4-hour chart
-637365546289000829.png)
On the 4-hour chart, LINK price managed to climb above the 12-EMA and could turn it into support in the short-term. The MACD flipped bullishly, and the trend is slowly shifting in favor of the bulls.
However, a bearish breakout below $8 would be devastating as there aren’t many support levels below it. If $8 cracks, LINK will re-test the low of $7.31.
On the other hand, if bullish momentum continues, we could see LINK re-test $10 as the next most crucial resistance level.
Author

Lorenzo Stroe
Independent Analyst
Lorenzo is an experienced Technical Analyst and Content Writer who has been working in the cryptocurrency industry since 2012. He also has a passion for trading.


