Bitcoin and Ethereum rebound strongly and are poised for further gains
- Bitcoin has bounced strongly towards $10,700, confirming a short-term trend change.
- Ethereum saw similar price action exploding to $350.

Bitcoin confirmed a 4-hour bear flag that got almost no continuation and went straight into a massive move towards $10,700. Similarly, Ethereum also bounced back up, although its bounce is comparatively weaker, it is trading at $347.
BTC/USD daily chart
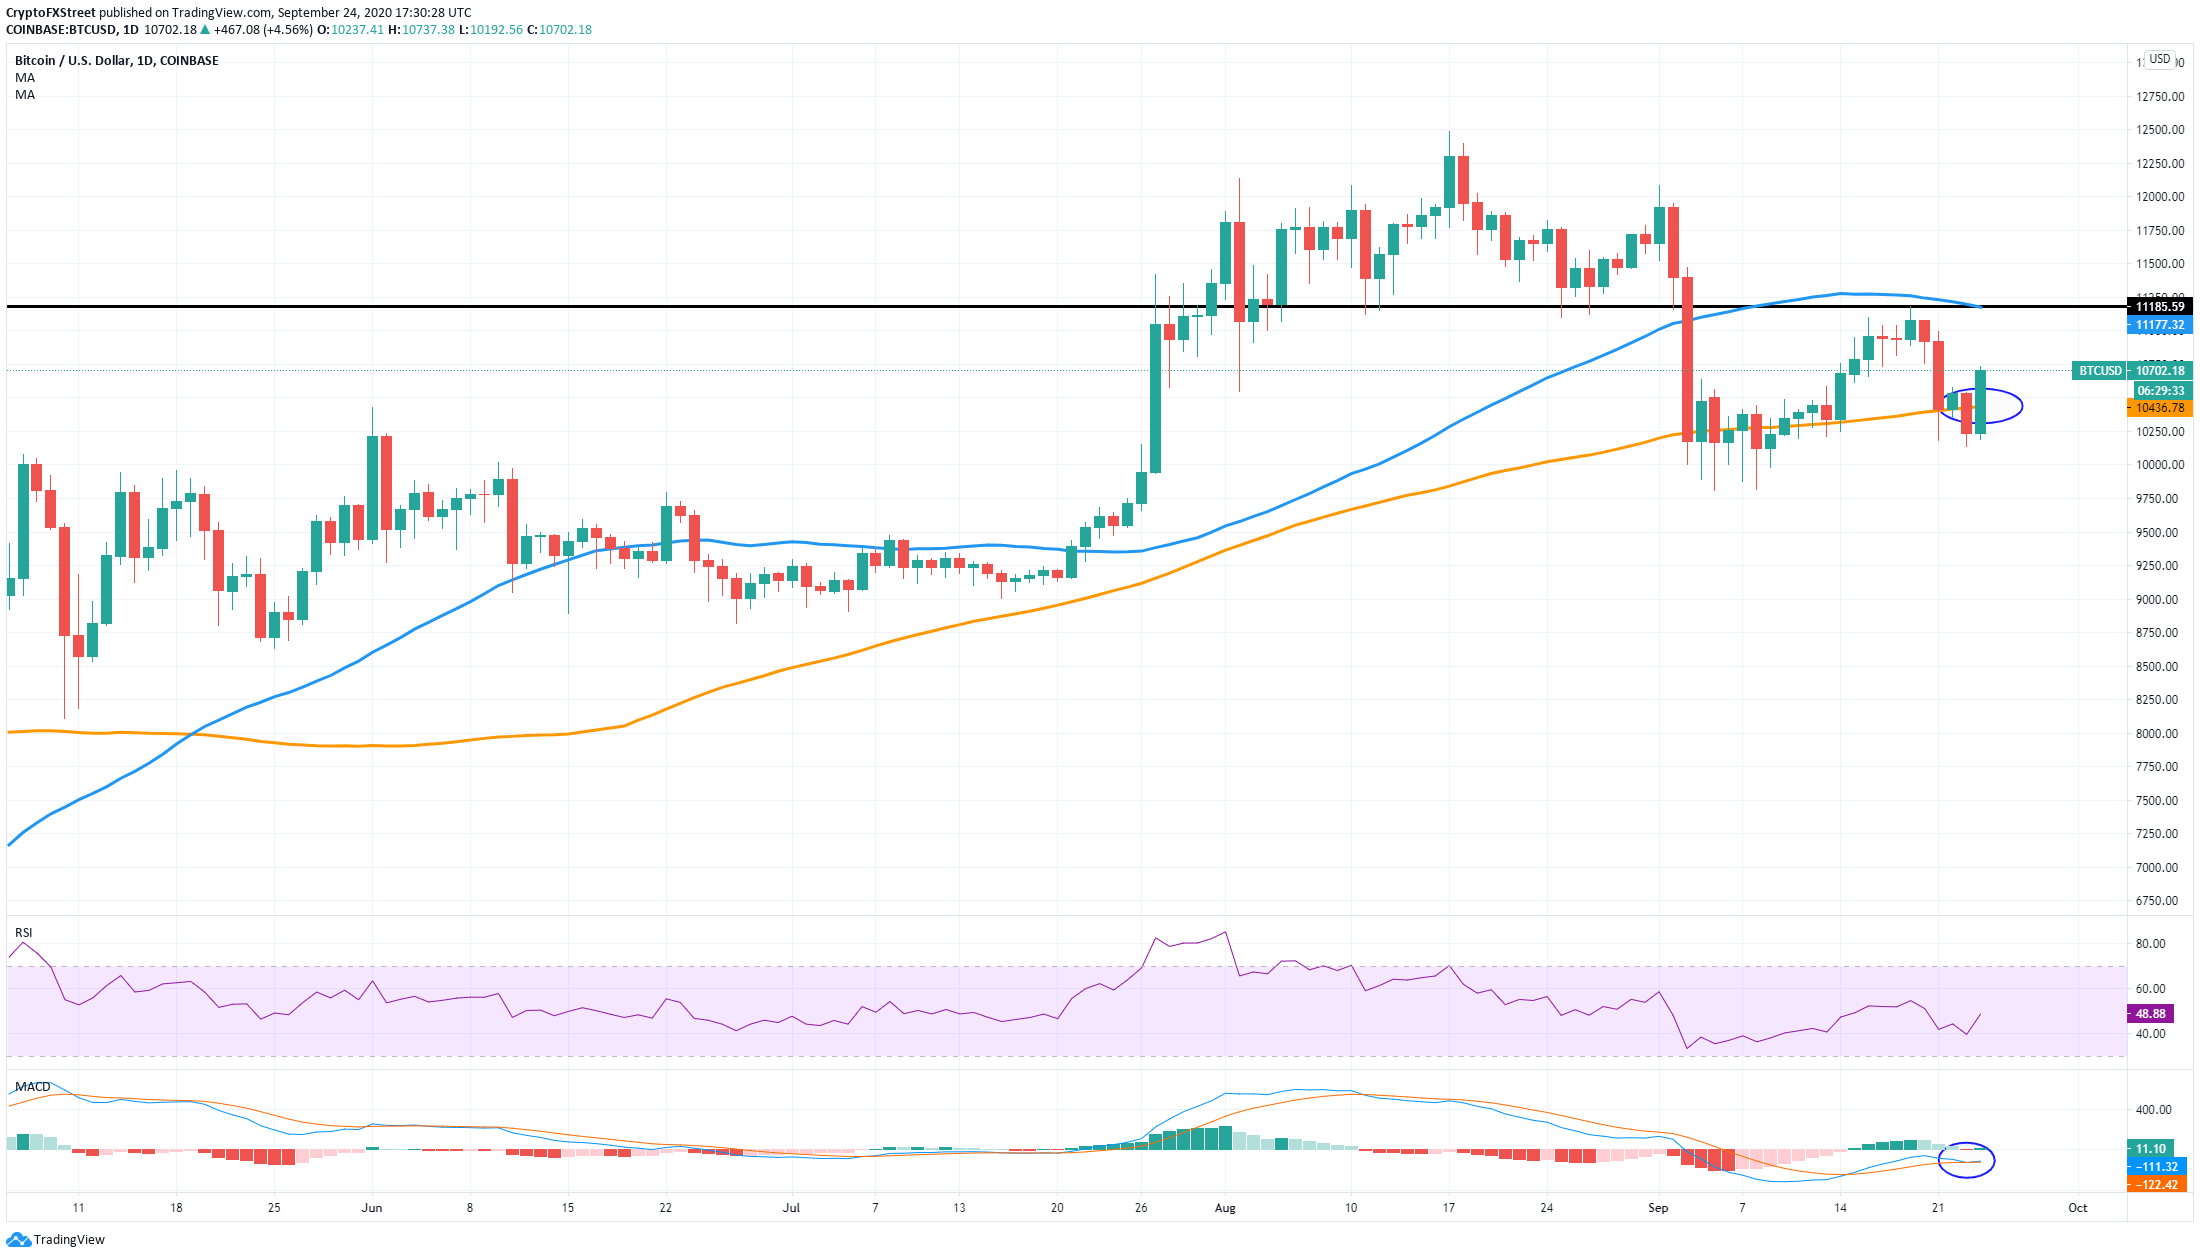
On the daily chart, Bitcoin price has regained the 100-MA as support at $10,436 and is now eying up the next resistance level at $11,179, coinciding with the 50-MA. The MACD turned bearish for a short period of time on September 23 but has flipped bullishly again now.
BTC/USD 12-hour chart
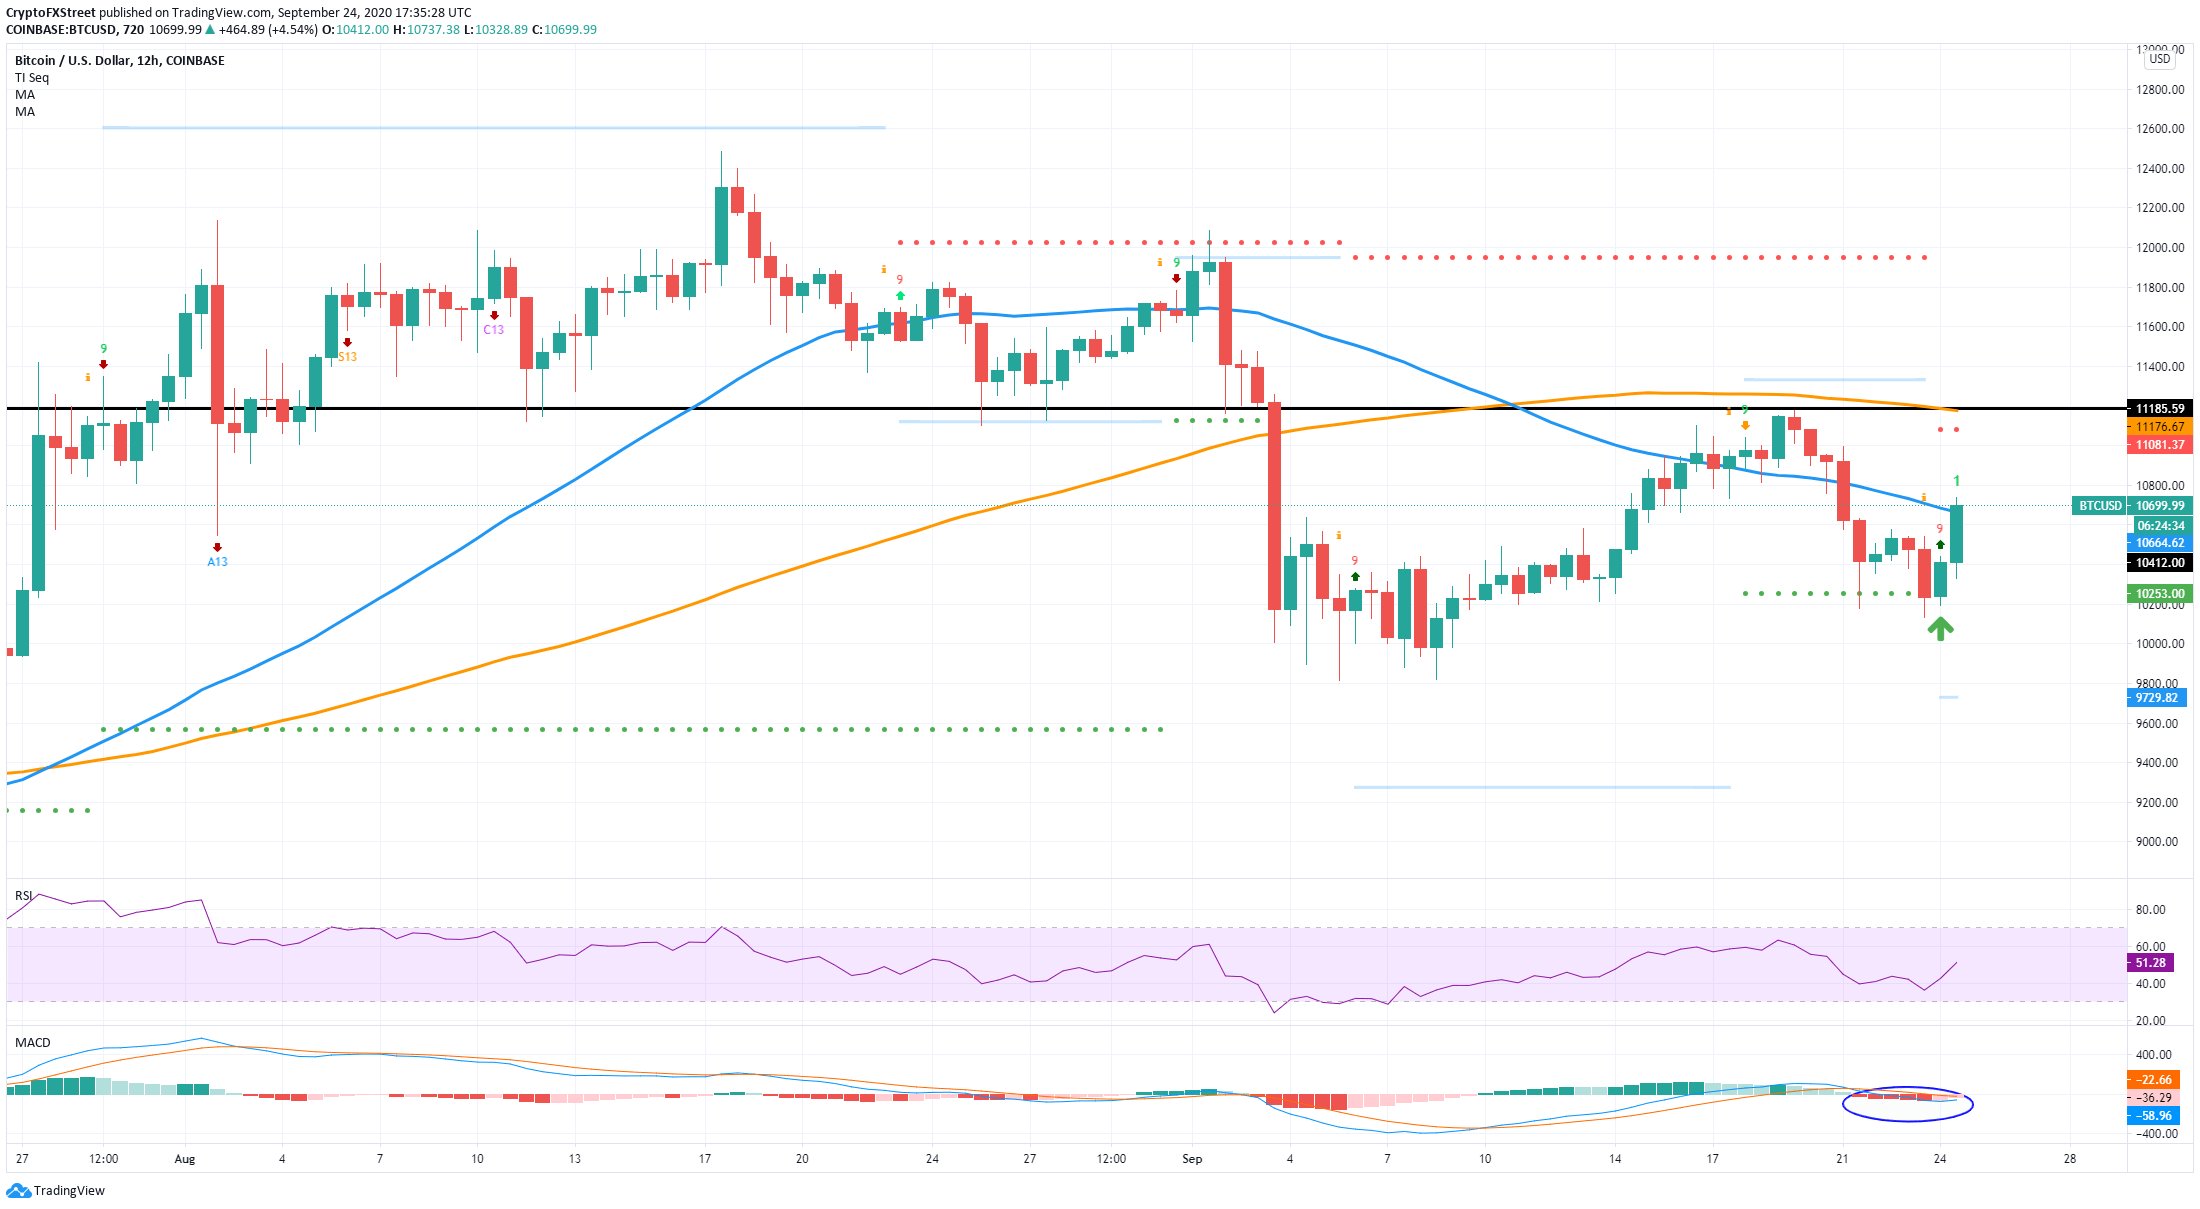
The TD sequential indicator has presented a buy signal at around $10,400. Bitcoin price is currently fighting to stay above the 50-MA at $10,664 and transform it into support here as well. The MACD hasn’t turned bullish just yet, but it’s close. The next resistance level here is also around $11,179.
Bitcoin IOMAP Chart
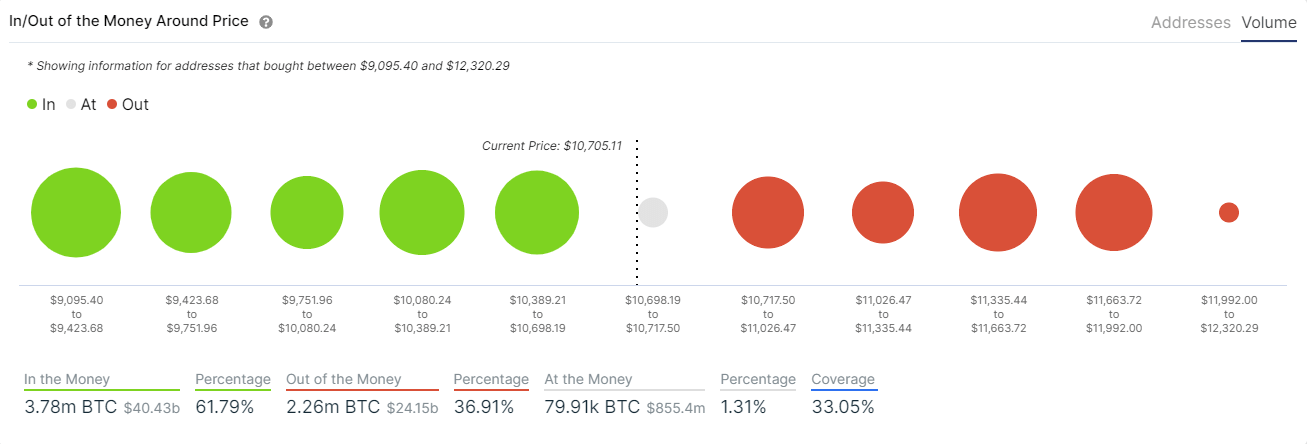
Looking at the In/Out of the Money Around Price chart by IntoTheBlock, we can see that Bitcoin is facing a fair amount of resistance at $10,870 and $11,178. However, more investors bought at $10,542 and below in comparison, which means Bitcoin currently has more support than opposition.
BTC/USD 4-hour chart
-637365667464742247.png)
We have similar price action on the 4-hour chart with Bitcoin regaining the 100-MA but getting stopped right at the 50-MA at $10,736. The MACD also turned bullish here, and the RSI has exploded to the upside getting closer to overextension levels.
ETH/USD daily chart
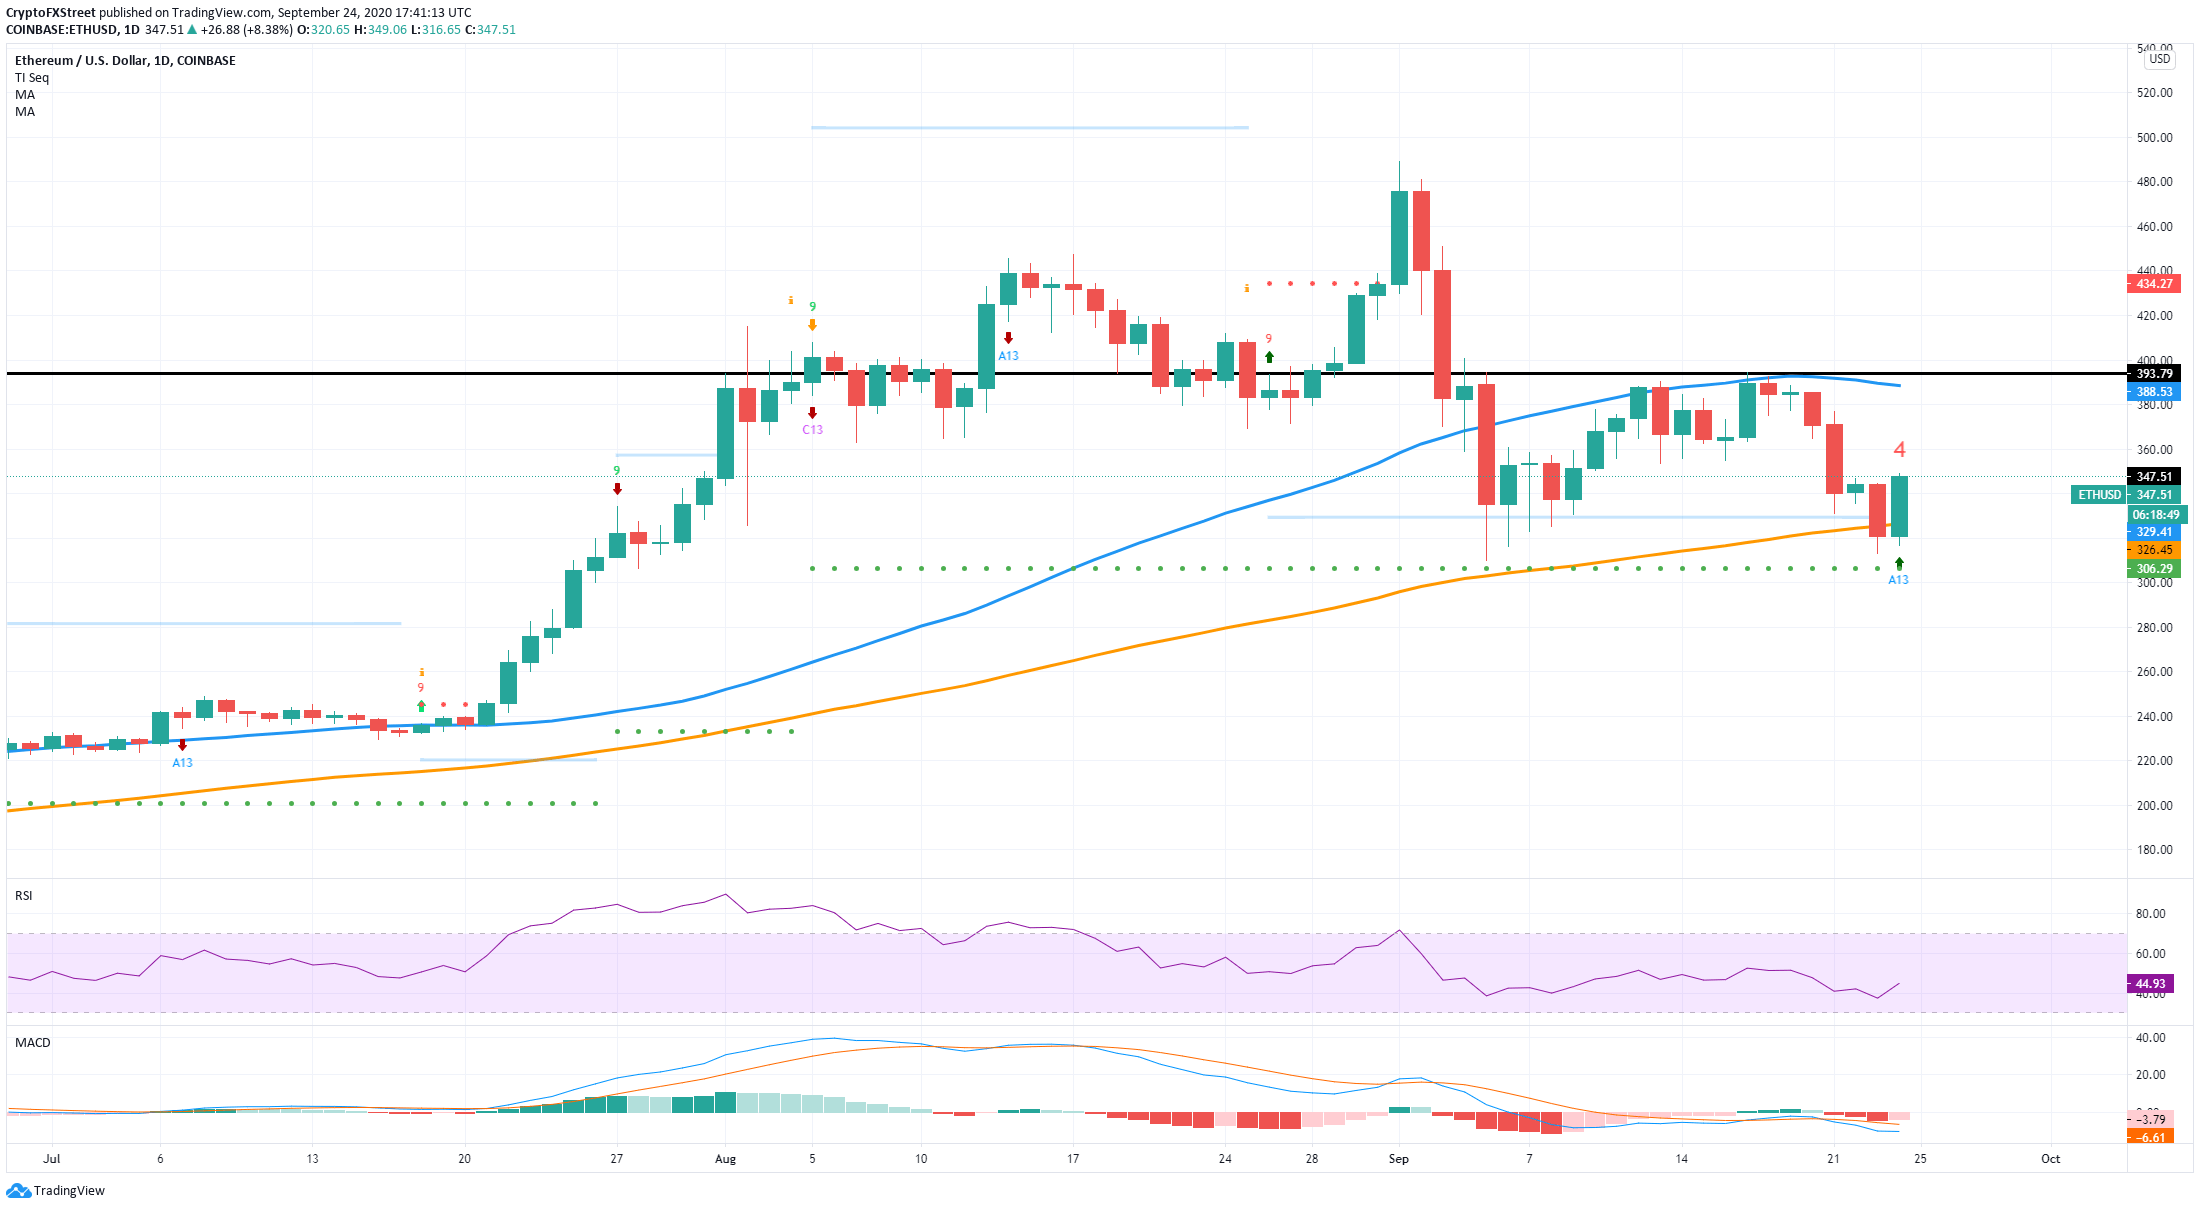
Ethereum has managed to regain its 100-MA on the daily chart; however, the TD sequential indicator hasn’t presented a buy signal yet. Another difference with Bitcoin is that the MACD hasn’t turned bullish and will require a few more days to do so. The next resistance level will most likely be $388 in the form of the 50-MA, followed by $394, the last high.
ETH/USD 12-hour chart
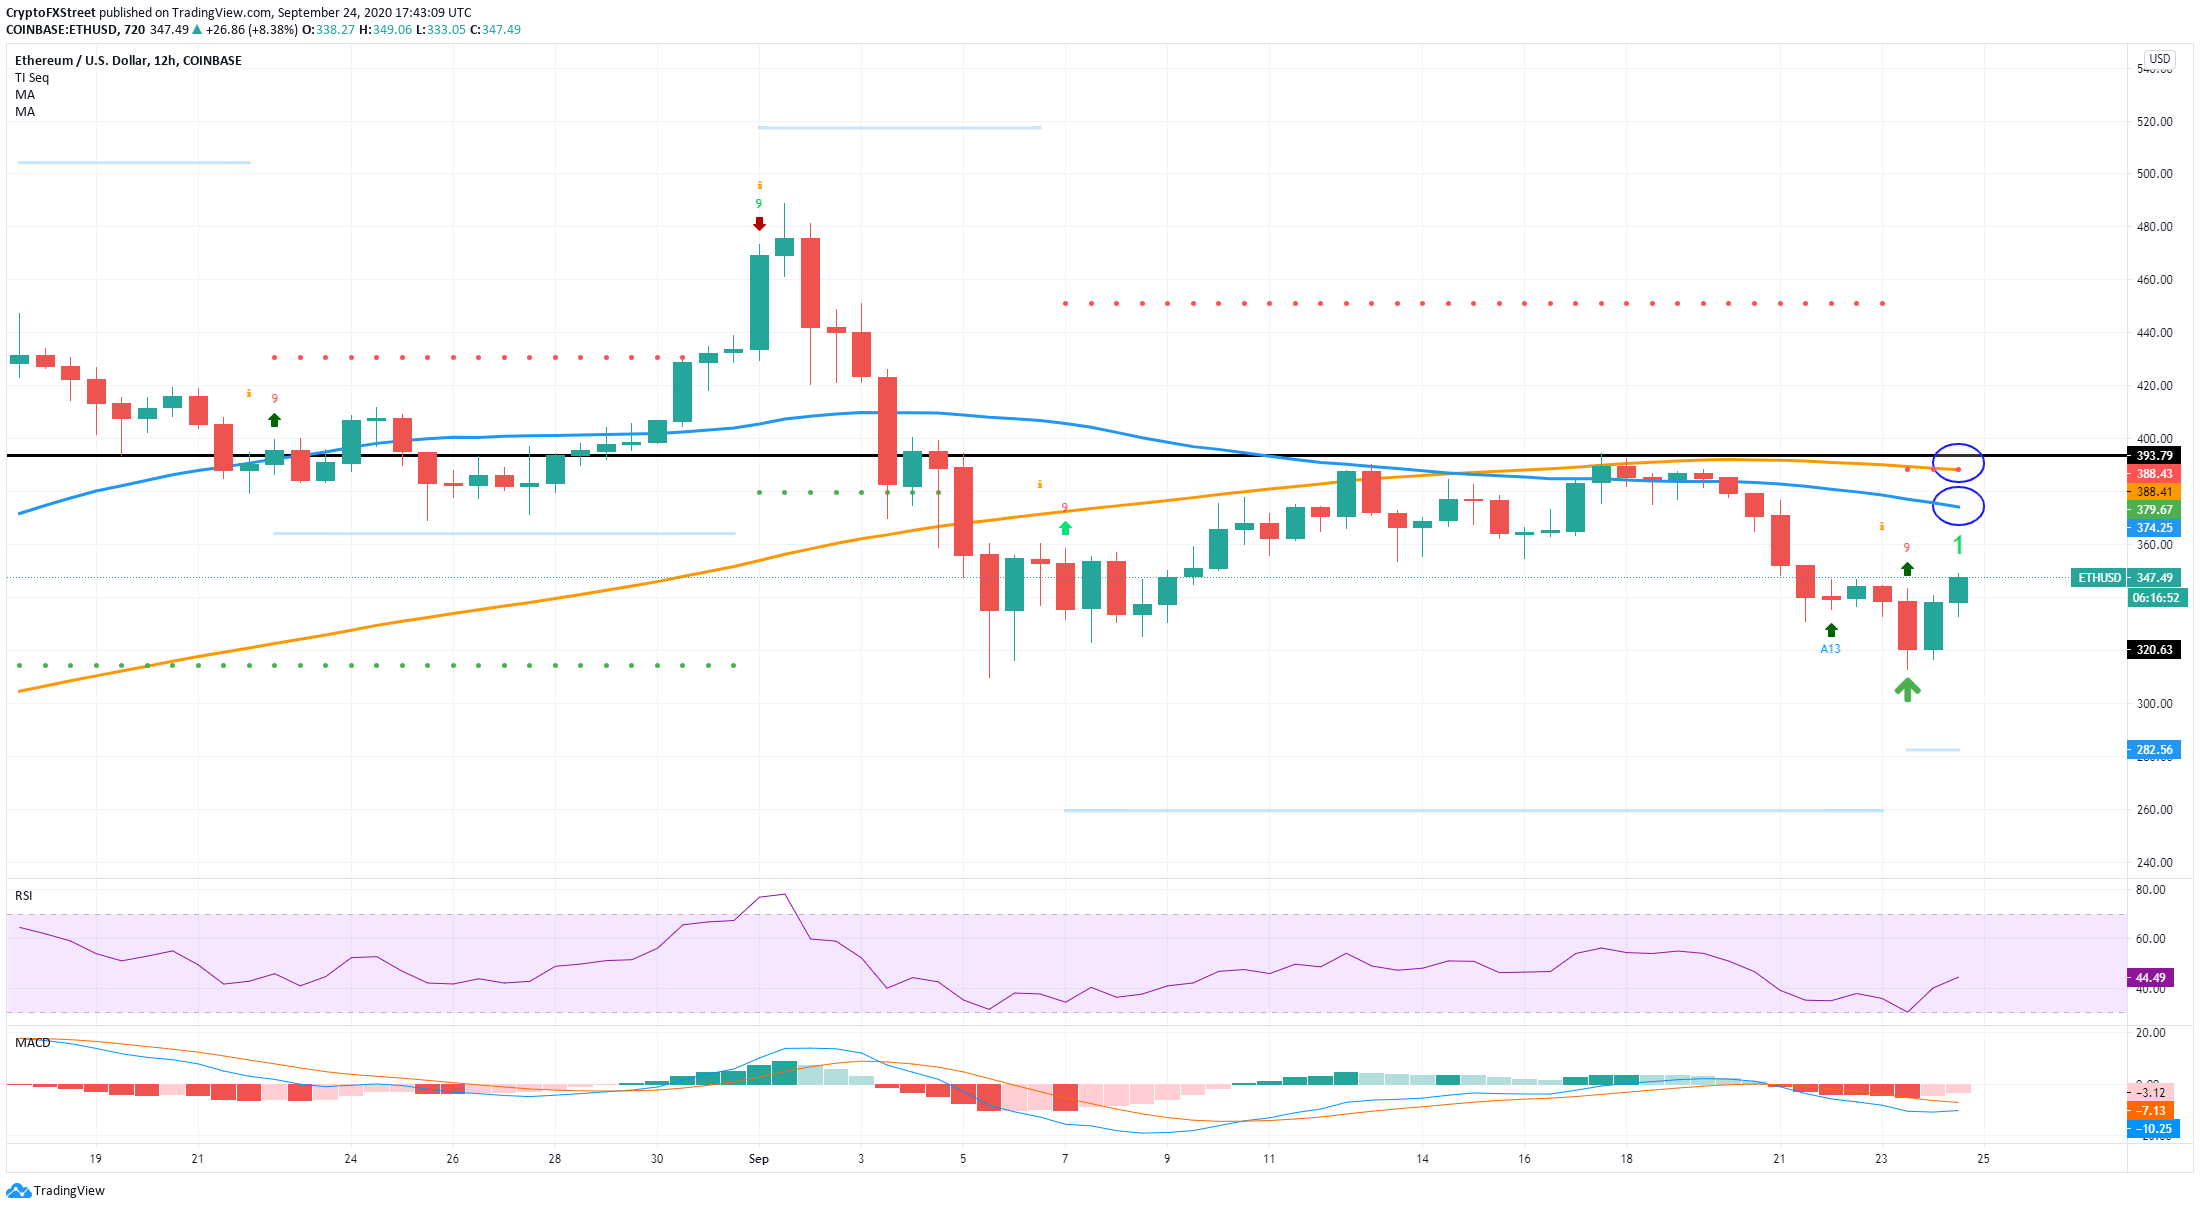
On the 12-hour chart, the TD sequential indicator has presented a buy signal, but Ethereum hasn’t regained its 50-MA or 100-MA. Similarly, the MACD remains bearish. The next target price for the smart-contracts giant will be $374, the 50-MA, and $388, the 100-MA. ETH price needs to regain at least one of them as support.
Ethereum IOMAP Chart
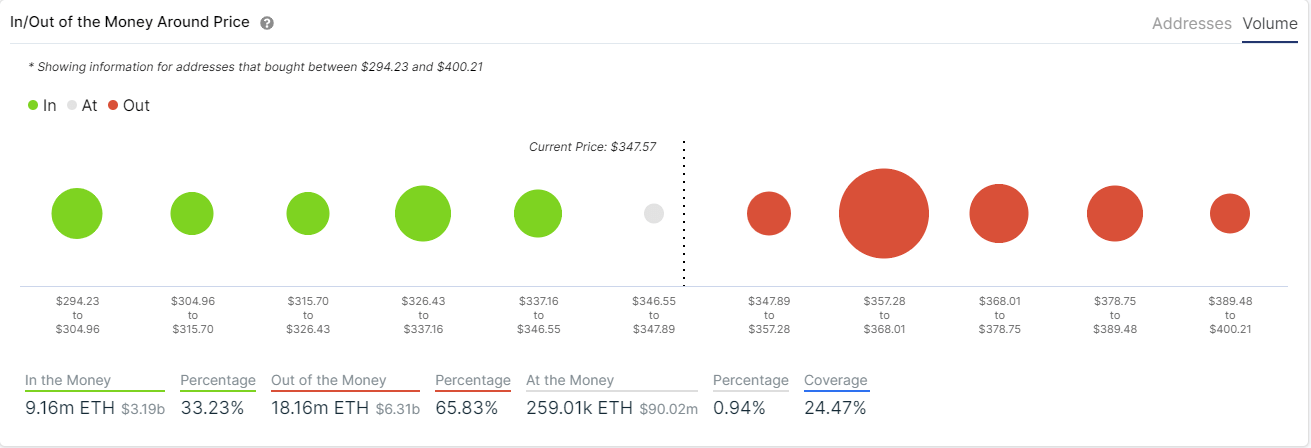
Looking at the IOMAP chart, we can see that the next resistance point would be at $363, where 445,000 addresses bought almost 10 million Ethereum coins. On the other hand, there isn’t much support on the way down compared to the resistance at $363, as only 1.75 million ETH coins were bought at $341.
ETH/USD 4-hour chart
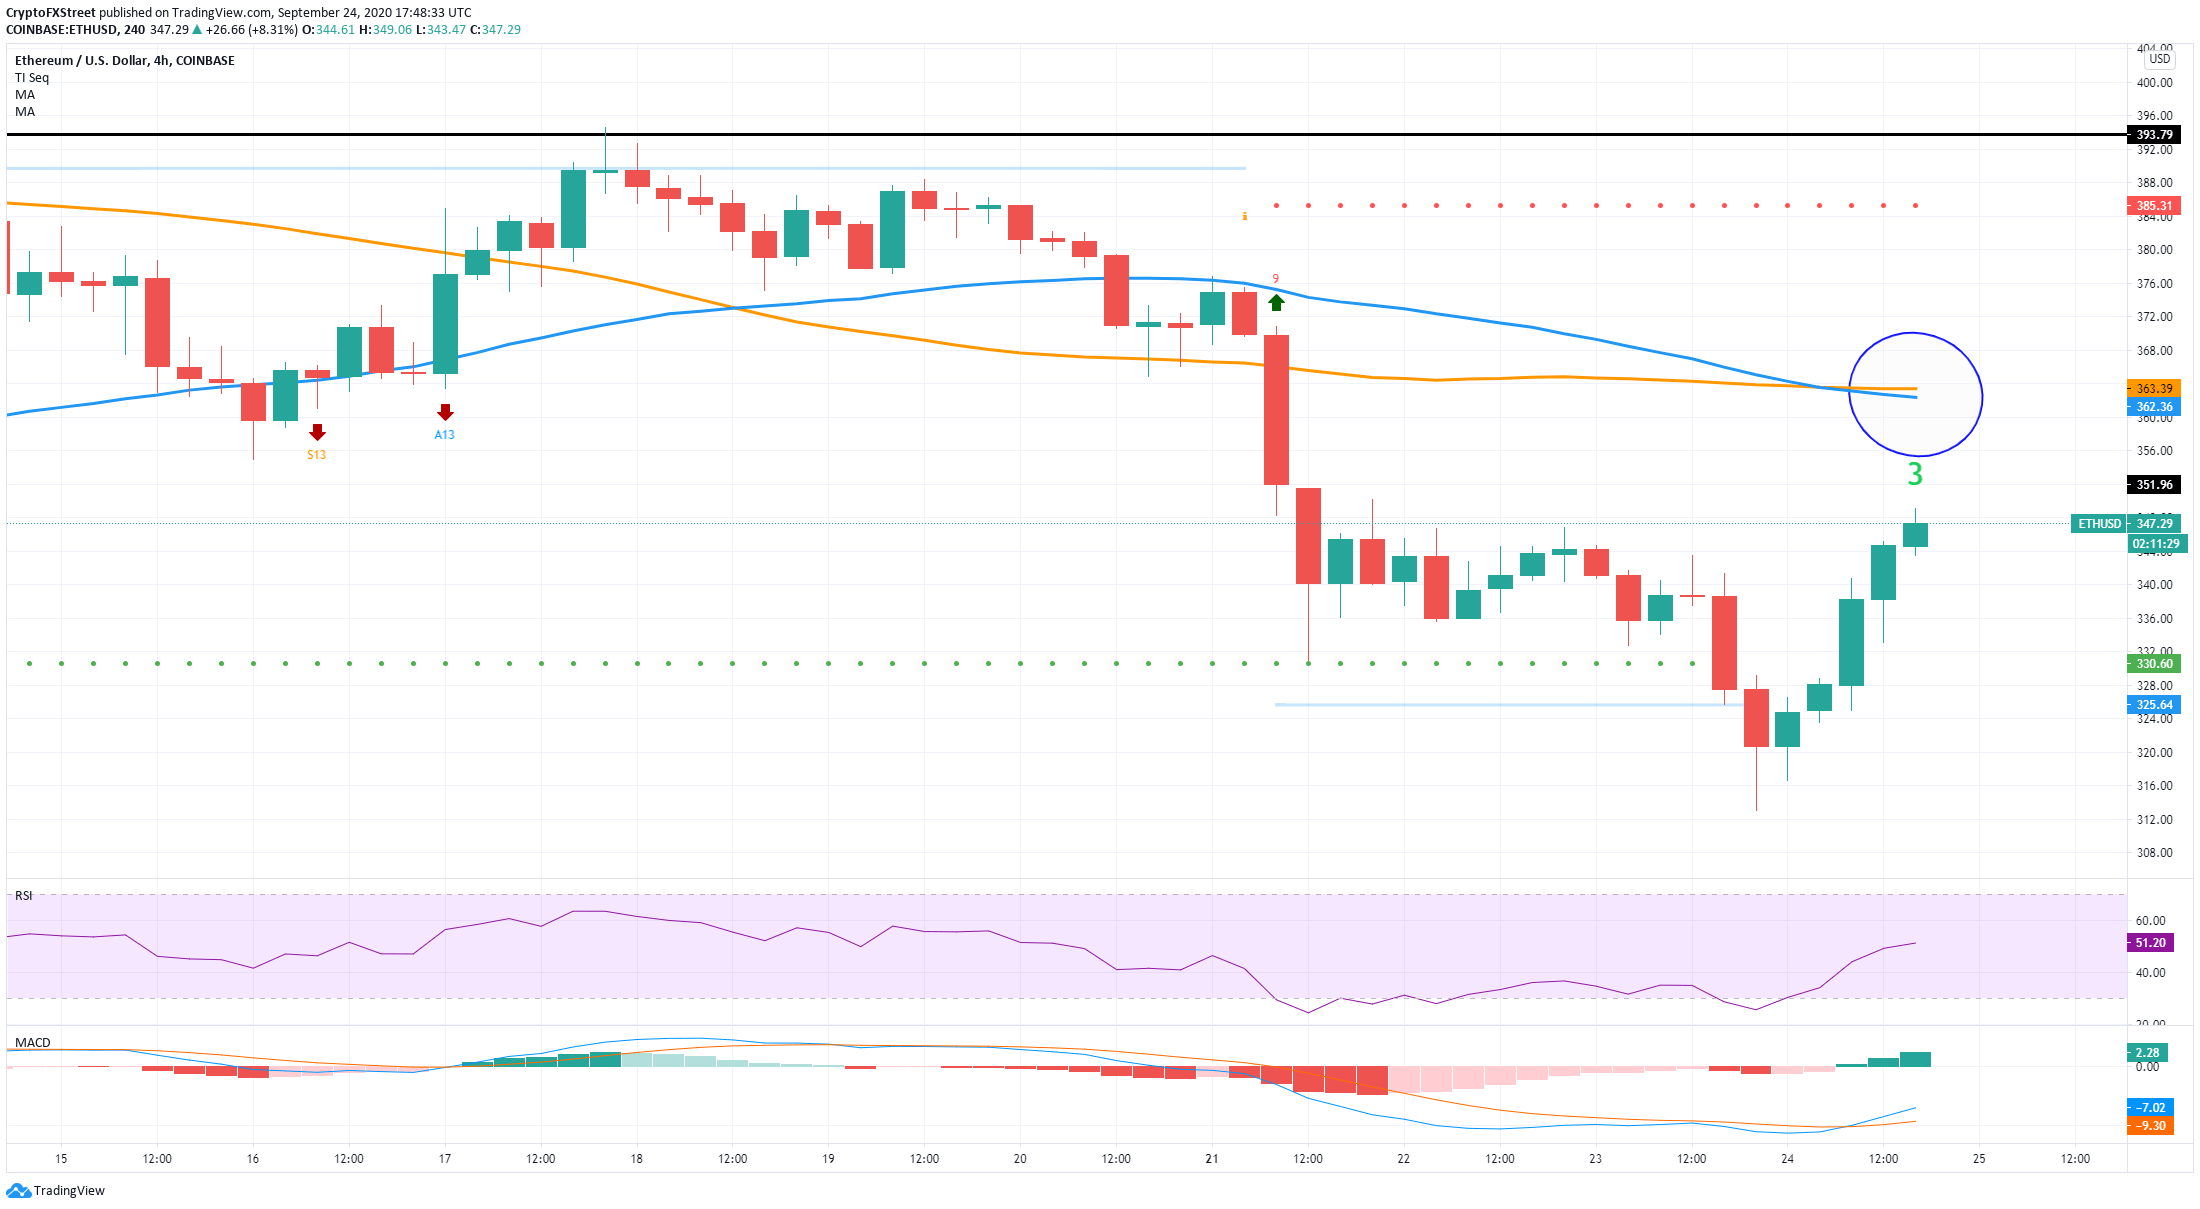
Nonetheless, Ethereum price has exploded above several resistance levels in the short term and turned its MACD bullishly. The next resistance is at $363, which coincides with the IOMAP chart and both the 100-MA and the 50-MA.
Ethereum bulls need to pay close attention to the nearest support levels at $341 and below as they aren’t too strong. In the short-term, the ETH price will most likely continue trending upwards until $363, the most critical resistance area in the short-term.
For Bitcoin, investors need to look at $10,870 as the first resistance level and then $11,178. A bearish break below $10,542 could be indicative of short-term weakness.
Author

Lorenzo Stroe
Independent Analyst
Lorenzo is an experienced Technical Analyst and Content Writer who has been working in the cryptocurrency industry since 2012. He also has a passion for trading.


