Swipe Price Analysis: SXP screams buy as the bulls look to jump in
- The 3-day and weekly charts have flashed buy signals, as per the TD indicator.
- The IOMAP shows a lack of strong resistance levels upfront.

Swipe dropped from $1.75 to $0.75 between September 30 and November 3. Since then, the bulls have made a comeback after the 1-day chart formed the bullish morning star pattern. As of now, more bullish movement is expected after SXP flashed multiple buy signals.
Swipe flashes multiple buy signals
Looking at the 3-day chart, one can see that the price has been on a steady downtrend till it flashed the red-nine candlestick in the TD sequential indicator. This has prompted the buyers to wake up from their slumber and take control of the price. The MACD also shows increasing market momentum.
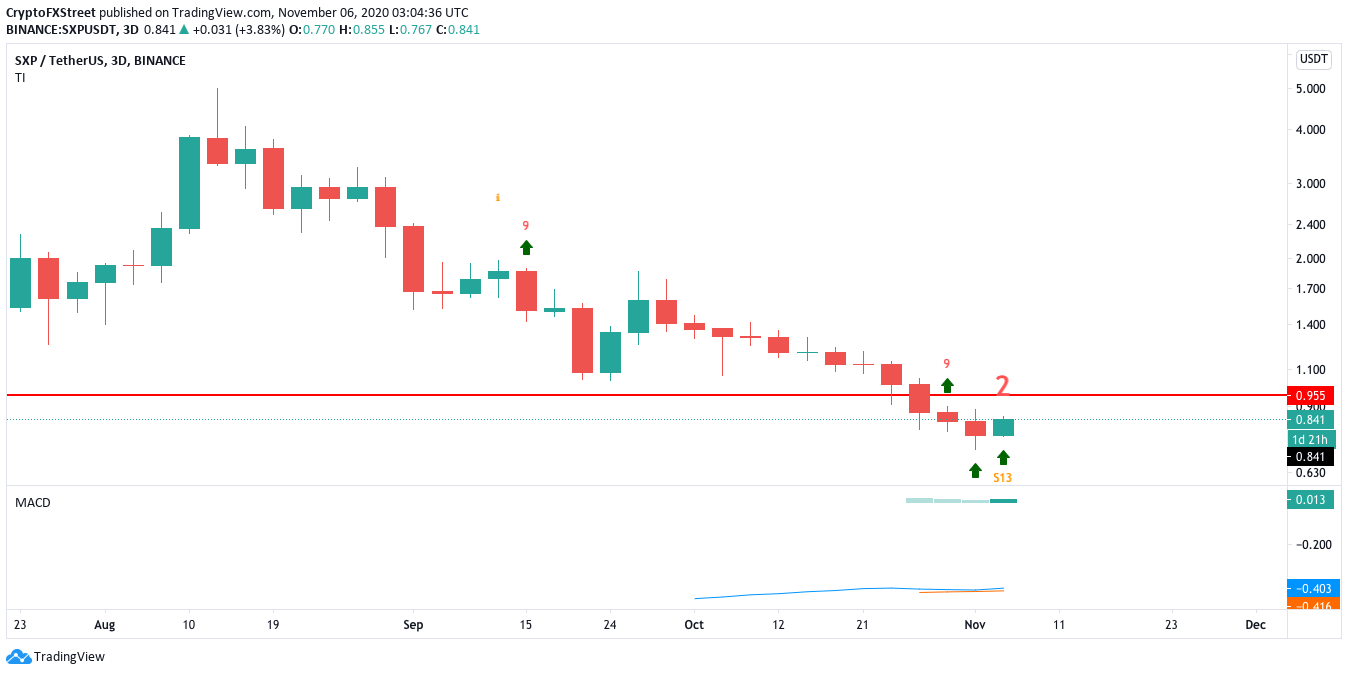
SXP/USDT 3-day chart
The buyers will aim to take the price to the $0.95 resistance barrier, as defined by IntoTheBlock’s In/Out of the Money Around Price (IOMAP). According to the IOMAP, 13 addresses had previously purchased 39 million tokens at this level. Up to this level, there is a lack of substantial resistance barriers.
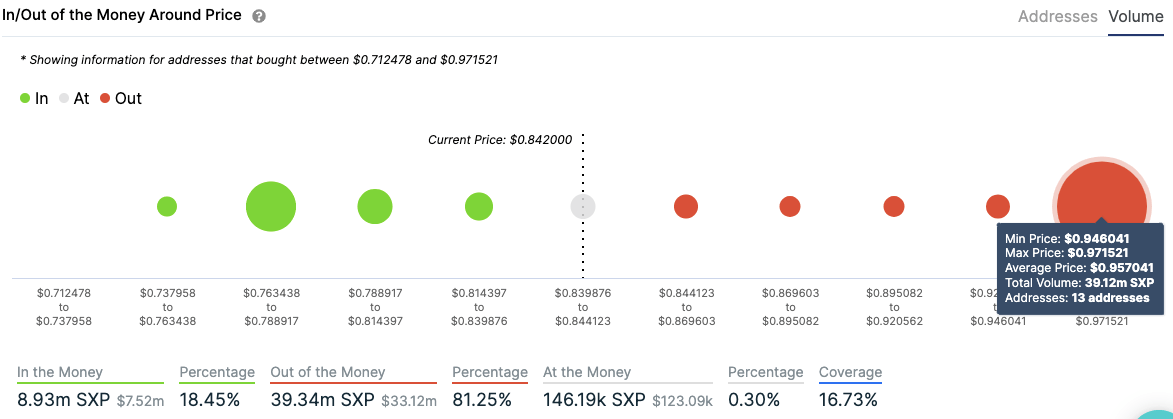
SXP IOMAP
The weekly chart has also flashed the buy signal in the TD sequential indicator with a red-nine candlestick. The price is on the verge of having a green candlestick following five consecutive bearish weeks. During this time period, the price dropped from $1.69 to $0.82.
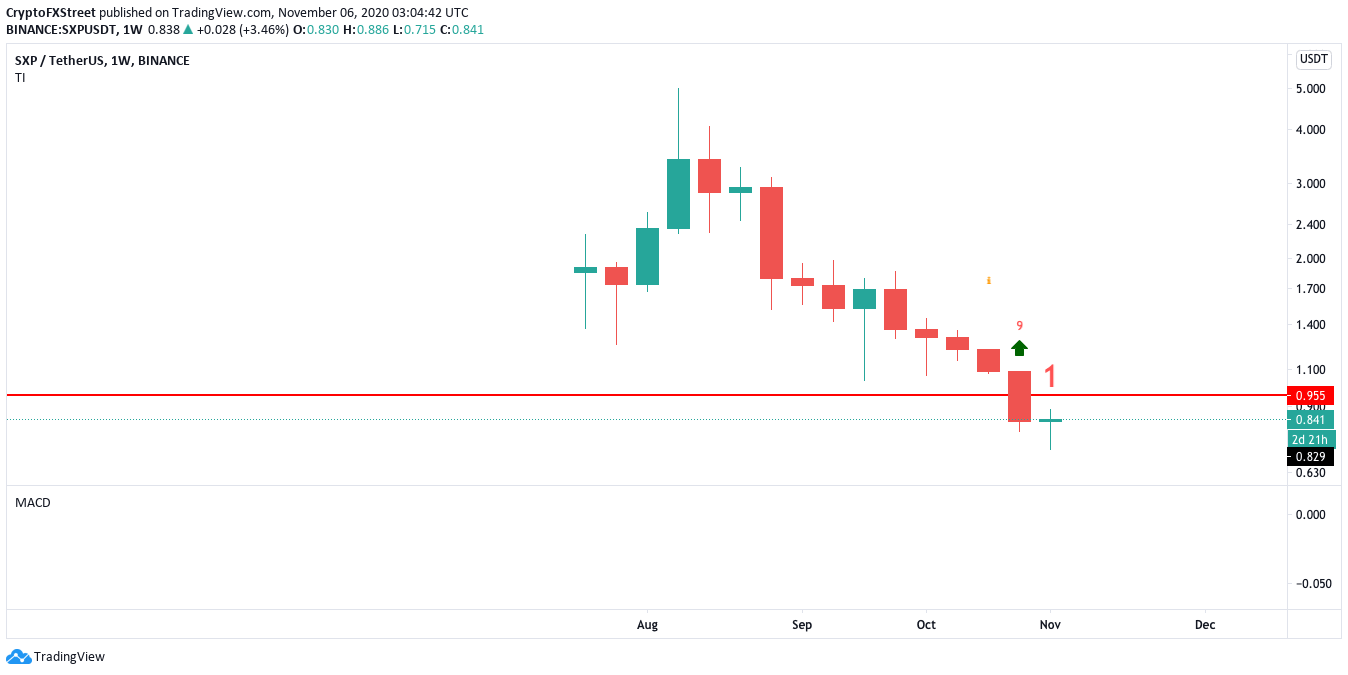
SXP weekly chart
While the outlook is bullish, the bears still have the license to take back control of the market. The whales have been dumping their holdings, adding sell pressure to the market. As per Santiment’s holders distribution chart, the number of addresses holding >10 million tokens dropped from 9 to 6 over the last month.
 [08.36.21, 06 Nov, 2020]-637402320587328215.png)
SXP holders distribution
The IOMAP shows that the bears can invalidate the buy signals by taking the price below the $0.78 support wall. If this level fails, it could be disastrous for the Swipe since the IOMAP shows a lack of healthy support on the downside.
Author

Rajarshi Mitra
Independent Analyst
Rajarshi entered the blockchain space in 2016. He is a blockchain researcher who has worked for Blockgeeks and has done research work for several ICOs. He gets regularly invited to give talks on the blockchain technology and cryptocurrencies.