Swipe Price Analysis: SXP downtrend continues after a 71% drop from $5
- SXP is currently trading at $1.46 after establishing a robust downtrend.
- The peak of SXP was $5, reaching a market capitalization of $314 million.

After a tremendous month in July and half of August, it seems that most of the hype behind SXP is now gone. The digital asset peaked at $5 on Binance but has lost more than 70% of its value in the last month and a half.
SXP/USD daily chart
-637359563819201804.png)
It seems that the only support level closeby is $1.25, established on July 27. Bears have been able to continuously push the price of SXP down, creating lower lows and higher lows.
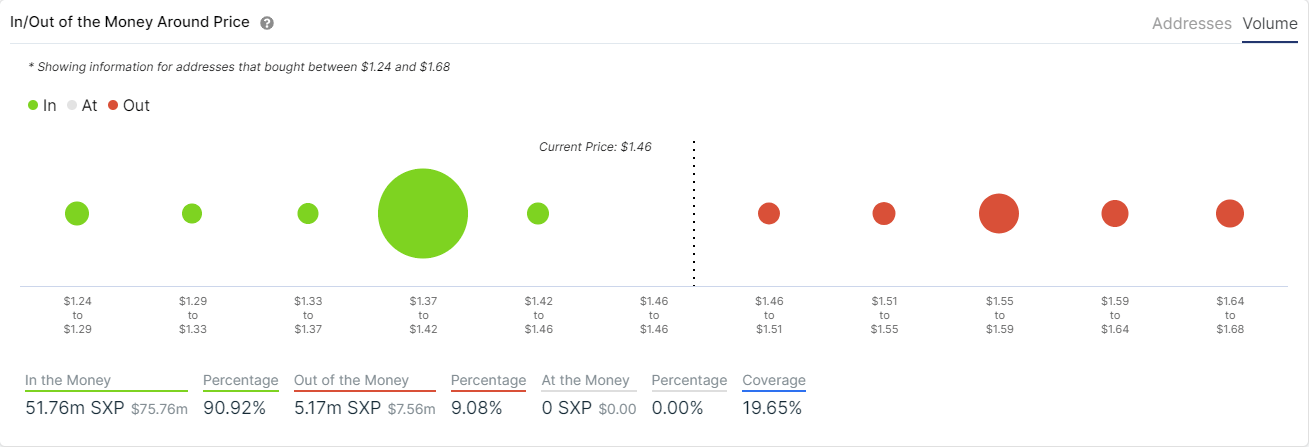
Studying the IOMAP chart, we can clearly see a massive support level right at $1.39 and nothing else around. A bearish breakout of this level would most likely take SXP down to $1.25.
SXP/USD 4-hour chart
-637359564180331979.png)
Bears still need to remain careful as the 4-hour chart could flip bullish in the short-term thanks to a buy signal from the TD sequential indicator. The RSI is also quite overextended and close to dropping below 30.

Additionally, looking at the IOMAP chart again, a defense of the $1.39 support level could help SXP to bounce back up and aim for $1.65 as there are relatively low resistance levels on the way up.
Author

Lorenzo Stroe
Independent Analyst
Lorenzo is an experienced Technical Analyst and Content Writer who has been working in the cryptocurrency industry since 2012. He also has a passion for trading.


